The button can be used to switch between the start and end points of the contour
as reference field for editing purposes. The active points are highlighted in light green
while the deactivated points are dark green.
7.3
Measurement data output
7.3.1
Monitor - scan view pro
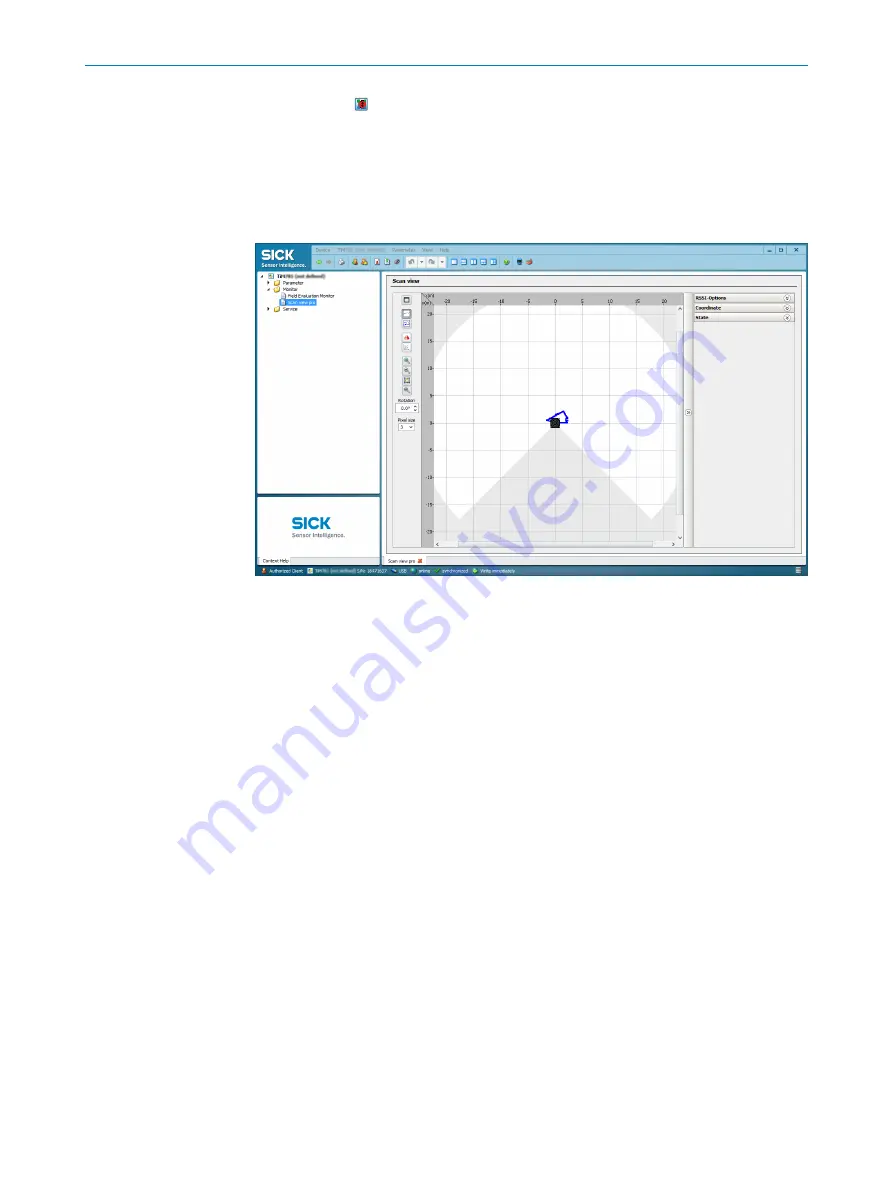
Figure 26: Device window: Monitor - scan view pro
In the Pro scan display window, SOPAS displays the field contour (scan line) currently
seen by the device through ambient reflection in blue.
The user can change parameters in the right part of the program window under
Settings & Device Status. SOPAS immediately transfers these changes to the device
(default setting).
7.3.2
Parameter - data processing
Data output format of the measured values
The data output format per scan is comprised of the measured values (radial distance,
RSSI signal level), device and status information and time stamp.
In the default settings, the distance is output as a measured value (in mm).
In order to output remission values in the telegram, select the RSSI checkbox.
To display the remission values in the scan as well, select the RSSI... checkbox under
“Monitor” > “scan view pro”.
Output range of the measured values
The device scans an angular range of 270° (-45° to 225°) and outputs one measured
value per angular increment (0.33° or 1° depending on the device type).
The angle range for which measured values can be output can be set using the Output
range input field (resolution corresponds to the angular resolution of the device).
7
OPERATION
44
O P E R A T I N G I N S T R U C T I O N S | TiM781
8024231/1G72/2022-05-27 | SICK
Subject to change without notice


