CorreluxView Software
31
6.6
Correlation
6.6.1
Perform and display a correlation
To display the correlation result for a measurement, proceed as follows:
Step Description
1
Select the relevant measurement in the directory tree.
2
Click on the
Correlation
button in the menu bar.
3
Result:
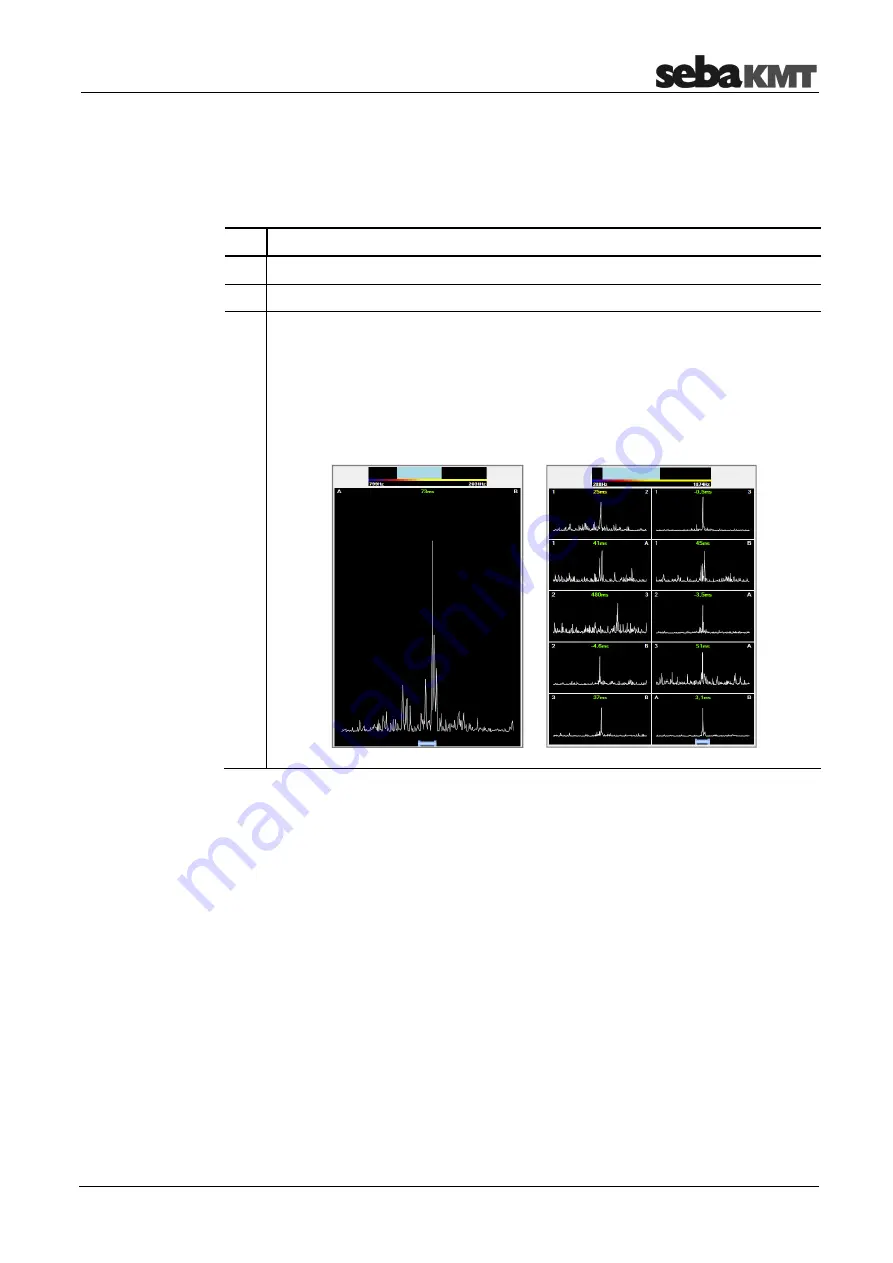
In the case of Online measurements, a single window will appear and
display the correlation result as a curve (left graphic).
In the case of Offline measurements, the application will provide up to
28 miniature windows (thumbnails) to display the result of the multi-correlation
(right graphic).
You will probably already be familiar with these correlation diagrams from your
work with the Correlator.
The frequency diagram at the very top of the screen allows you to set a frequency filter
and to repeat the correlation.
First, go to the graphic and click on your desired lower frequency limit, keeping your
mouse key held down. Then move your mouse cursor to the right and let the key go
when you've reached your desired upper frequency limit. The correlation/multi-
correlation will update immediately, taking into consideration only the frequency range
marked in blue.
Using the
Measurement
tab at the top of the display area you can return to the view
that shows the sensor list and the map. Use the
Correlation
tab to call the correlation or
multicorrelation view again.
Set frequency filters
Change
display area view
Содержание COR C-300-RI
Страница 2: ...Consultation with SebaKMT 2...
Страница 7: ...Terms of Warranty 7...
Страница 24: ...The Multi sensors 24...


