background image

12

© 2014 Proceq SA

4.1.4 A-Scan Mode (Zonotip

+

 only)  

 
The A-Scan mode allows excluding measurement inaccuracies, caused by e.g. flaws or cracks in 
the test object. The signal is visualized on the display as an A-Scan, which allows a more indepth 
analysis of the reading.
The A-Scan mode features the following measurement options: 
•  thickness of a test object even if it contains flaws or cracks
•  general flaw and crack detection
•  bond quality of layered materials, including delamination detection
•  thickness of layered materials

It is also possible to zoom in on an arbitrary location of the A-Scan in order to interpret the meas-
urements better. Furthermore, the horizontal and vertical position as well as the length of the gate 
(red horizontal bar) can be adjusted. The gate feature is especially useful for situations where 
several echos appear in the A-Scan. Therefore, the gate must be moved to the echo that needs 
to be evaluated. 
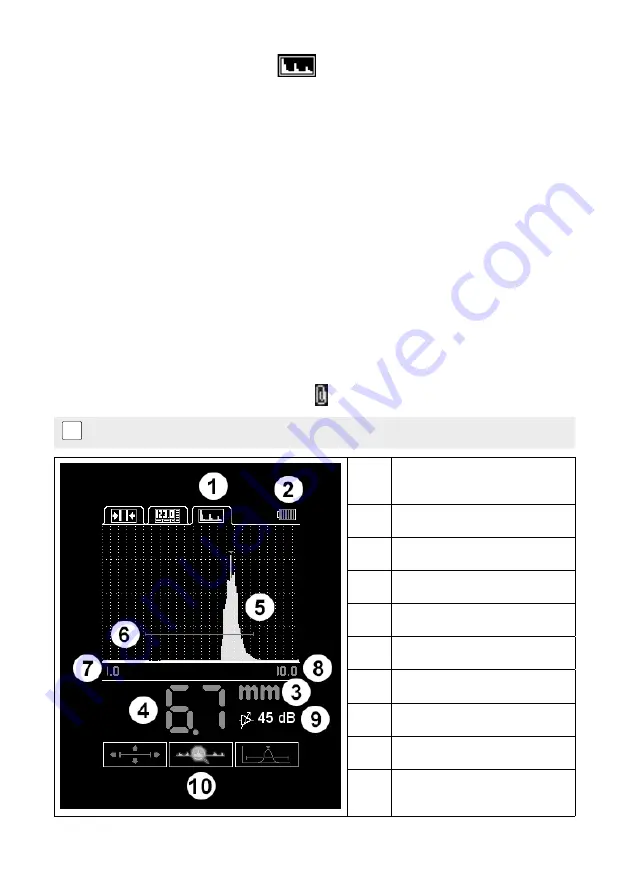
The screen is divided into two parts: the upper part shows the signal, the lower part displays the 
numerical values of the parameters and the operation pictograms (see chapter 4.2.2). 
The results of the A-Scan measurement are saved at the end of the last used measurement group. 
The latter is created in the Memory mode (see chapter 4.1.3). To view the saved A-Scans, switch to 
the Memory mode. The saved A-Scans have the   symbol to the left of the test results. 

i

When returning to the A-Scan mode, the graphic image of the A-Scan will be lost.

1.

Active bookmark of A-Scan 
mode

2.

Battery charge indicator

3.

Measurement units

4.

Measurement results

5.

A-Scan signal

6.

Gate 

7.

Scan beginning

8.

Scan end 

9.

Gain

10.

Operation pictograms
(see chapter 4.2.2)

Содержание 790 10 000

Страница 1: ...Made in Switzerland Operating Instructions Thickness Gauge...

Страница 2: ...Norm Mode 10 4 1 3 Memory Mode 11 4 1 4 A Scan Mode 12 4 2 Pictograms 13 4 2 1 Signal Strength Indicators and Measurement Method 13 4 2 2 Operation Pictograms A Scan 14 4 3 Setup Screen 14 4 3 1 Creat...

Страница 3: ...nd its components Unauthorized structural modifications to the instrument and its components Serious damage resulting from the effects of foreign bodies accidents vandalism and force majeure All infor...

Страница 4: ...probe is installed has cavities the US pulses will be reflected from them and the thickness is determined as the shortest distance from the external surface to these cavities The Zonolink Software in...

Страница 5: ...Navigation keys Zeroing sample test plate USB Port Figure 2 The Zonotip instrument Figure 3 Connection of the 4 0 MHz transducer Make sure the red cable is connected to the port with the red dot Figu...

Страница 6: ...as or in areas that are harder to access The 2 5 MHz is included when purchasing the Zonotip unit It is also available separately Figure 5 4 0 MHz transducer D1771 Figure 6 2 5 MHz transducer S3567 3...

Страница 7: ...The different modes are explained in chapter 4 1 Select the probe which you have connected A text will appear on the screen Please follow these instructions This process is needed to calibrate the in...

Страница 8: ...aterial 3 Calibrating on 4 Monitor 5 Limit beginning 6 Limit end 7 Discrete 8 Sound 9 Vibration 10 Language 11 Measuring units 12 Brightness 13 Mode 1 Probe 2 Material 3 Calibrating on 4 Monitor 5 Lim...

Страница 9: ...4 Run for details see 4 3 2 Edit Monitor 5 Inside Off Outside Limit beginning 6 Edit for details see 4 3 2 Limit end 7 Edit for details see 4 3 2 Discrete 8 0 1 Select the number of decimals 0 01 Sou...

Страница 10: ...bles the Zonotip to promptly determine the thickness of the test object and to set the monitor 5 response range If monitor 5 is set to inside and the readings are within the defined limits the reading...

Страница 11: ...ill appear on the instrument screen To store a measurement please press 1 Active bookmark of the Memory mode 2 Battery charge indicator 3 Measurement units 4 Measurement result 5 Indicator of the meas...

Страница 12: ...ntal bar can be adjusted The gate feature is especially useful for situations where several echos appear in the A Scan Therefore the gate must be moved to the echo that needs to be evaluated The scree...

Страница 13: ...Horizontal scrolling of the signal on the screen Set the signal gain in decibel 4 2 Pictograms 4 2 1 Signal Strength Indicators and Measurement Method Norm Mode and Memory Mode only Signal level is m...

Страница 14: ...of the signal within the gate is used for the measurement Selection of the measurement method Auto Correlation Function ACF is applied to the signals within the gate 4 3 Setup Screen 4 3 1 Create a Ne...

Страница 15: ...t response conditions for color sound or vibration alarm Inside results are within the set interval Outside results are not in the set interval Off monitor is switched off Limit beginning 6 All Modes...

Страница 16: ...rganic glass 2550 Marble 6150 Tantalum 4235 Silicate glass 5500 Silver 3600 Manganese 5561 Teflon 1350 Lead 2160 Magnesium 5790 Steel St3 5930 Tin 3320 Cast iron 3500 5600 Textolite 2920 Nickel 5630 L...

Страница 17: ...r the user can select any folder to save the data in The default name of the file will have the format resultsX where X is an index number The index number is generated automatically from the numbers...

Страница 18: ...250 g Display type TFT Permissible surface roughness Rz160 N12 Ra 50 m Minimum curvature radius 10 mm 0 4 inch Ultrasonic velocity range from 1000 to 9999 m s Data memory 100 groups each max 500 measu...

Страница 19: ...ase 8 2 Parts and Accessories 790 11 001 D1771 Ultrasonic Transducer 4 0 MHz 790 12 001 S3567 Ultrasonic Transducer 2 5 MHz 710 10 031 Ultrasound couplant 250 ml 790 80 001 Step Test Block inches 790...

Страница 20: ...oceq com Proceq Rus LLC Ul Optikov 4 korp 2 lit A Office 410 197374 St Petersburg Russia Phone Fax 7 812 448 35 00 info russia proceq com Proceq Middle East P O Box 8365 SAIF Zone Sharjah U A E Phone...

Отзывы: