12
© 2009 by Proceq SA
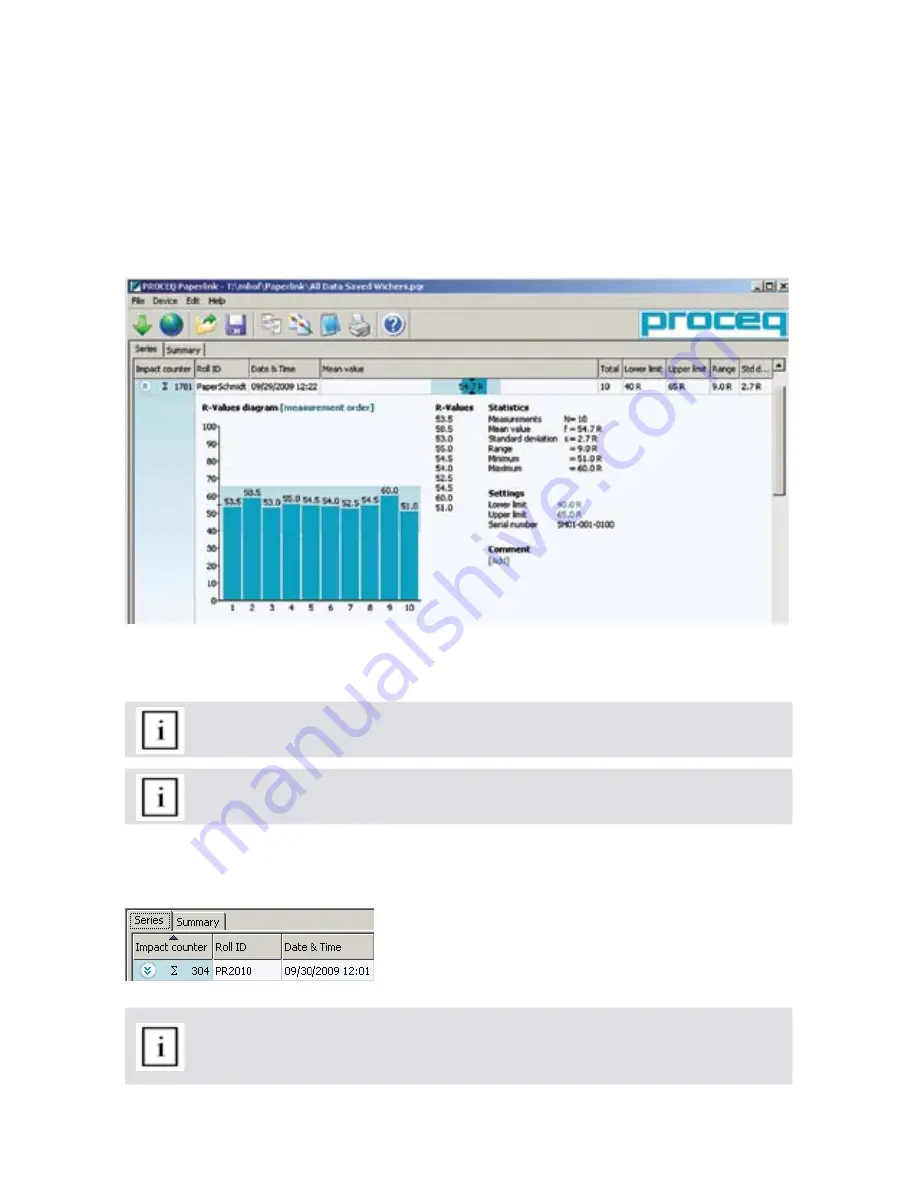
The test series is identified by the “Impact counter” value and by a “Roll ID” if assigned.
The user may alter the Roll ID directly in the “Roll ID” column.
•
The “Date & Time” when the measurement series was made.
•
The “Mean value”.
•
The “Total” number of impacts in this series.
•
The “Lower limit” and “Upper limit” set for that series.
•
The “Range” of the values in this series.
•
The “Std dev.” Standard deviation of the measurement series.
•
Click on the double arrow icon in the impact counter column to see the profile.
If limits have been set, they are displayed as above with a blue band. It is also possible to adjust the
limits directly in this window by clicking on the blue limit values.
Note: The user may also add a comment to the measurement series. To do so, click
on “Add”.
Note: The user may alter the order in which the measurements are shown. Click on
“measurement order” to switch to “ordered by value”
.
Summary window
In addition to the above “Series” view, Paperlink also offers a “Summary” window. This is useful when
comparing a batch of rolls of the same type. Click on the respective tab to switch between views.
Note: To include or exclude a series from the summary, click on the summary symbol
in the impact counter column. This symbol is either “black” or “greyed out”, which
shows whether or not the particular series is included in the summary. The summary
view can be adjusted in a similar way to the detailed view of a series.
”.


