Performance
Section 3-2
23
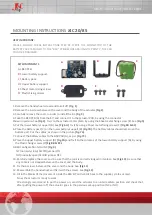
Bus cycle time vs number of slaves
0.0
5.0
10.0
15.0
20.0
25.0
0
4
8
12
16
20
24
28
32
Slaves
B
u
s
c
y
c
le
t
im
e
[
m
s
]
500
1500
3000
12000
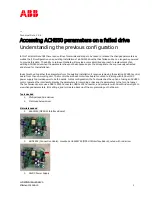
The second figure shows the effect of the number of masters on the bus cycle
time. The values of the parameters are:
n
= 4
ns
= nm (each master has one slave)
nm
= variable on the x-axis
nr
= 0
Baud rate
= variable per curve
Bus cycle time vs number of masters
0.0
5.0
10.0
15.0
20.0
25.0
30.0
35.0
40.0
0
4
8
12
16
20
24
28
32
Masters
B
u
s
c
y
c
le
t
im
e
[
m
s
]
500
1500
3000
12000
Baud rate
kbit/s
This figure is resembles the first figure. An increase of the number of masters
also increases the number of slaves and thus increases the number of data
bytes that needs to be transferred. The only difference is the addition of the
time to pass the token from one master to the other master and the total time
on checking the stations is increased. This is an addition of about 270 t
BIT
per
additional master.
Содержание C200HW-PRM21
Страница 1: ...C200HW PRM21 PROFIBUS DP Master Unit OPERATION MANUAL Cat No W349 E2 2...
Страница 2: ......
Страница 3: ......
Страница 4: ......
Страница 5: ...C200HW PRM21 PROFIBUS DP Master Unit Operation Manual Produced May 2000...
Страница 6: ...iv...
Страница 8: ...vi...
Страница 12: ...x...
Страница 66: ...Debug mode Section 4 4 50...
Страница 98: ...Messages Section 6 4 82...
Страница 108: ...Maintenance Section 7 3 92...
Страница 110: ...94...
Страница 112: ...96...
Страница 116: ...100...
Страница 120: ...104...
Страница 124: ......
Страница 126: ...Authorised Distributor Cat No W349 E2 2 Note Specifications subject to change without notice Printed in the Netherlands...