


5
Open
http://localhost/phpsysinfo/
in a Web browser window. The
browser window should display network usage and system information.
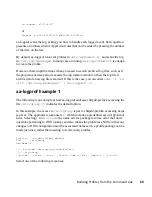
NOTE: Data Caching
To ensure that this request is processed by the server and you do not
review cached data in your browser, refresh the page. To do this, click
the browser Refresh button to make sure that Apache processes the re-
quest for the
phpsysinfo
URI.
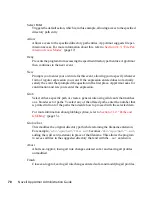
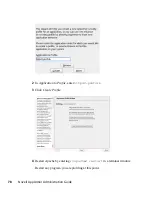
6
Click Scan System Log for Entries to Add to Profiles. Novell AppArmor
launches the
aa-logprof
tool, which scans the information learned in the
previous step. It begins to prompt you with profile questions.
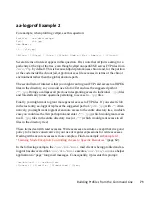
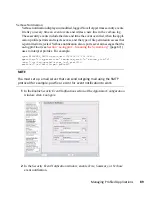
7
aa-logprof
first prompts with Add Requested Hat or Use Default Hat because
it noticed that the
phpsysinfo
URI was accessed. Select Add Requested Hat.
8
Click Allow.
Choosing Add Requested Hat in the previous step creates a new hat in the profile
and specifies that the results of subsequent questions about the script's actions
are added to the newly created hat rather than the default hat for this application.
Profiling Your Web Applications Using ChangeHat
79


