9
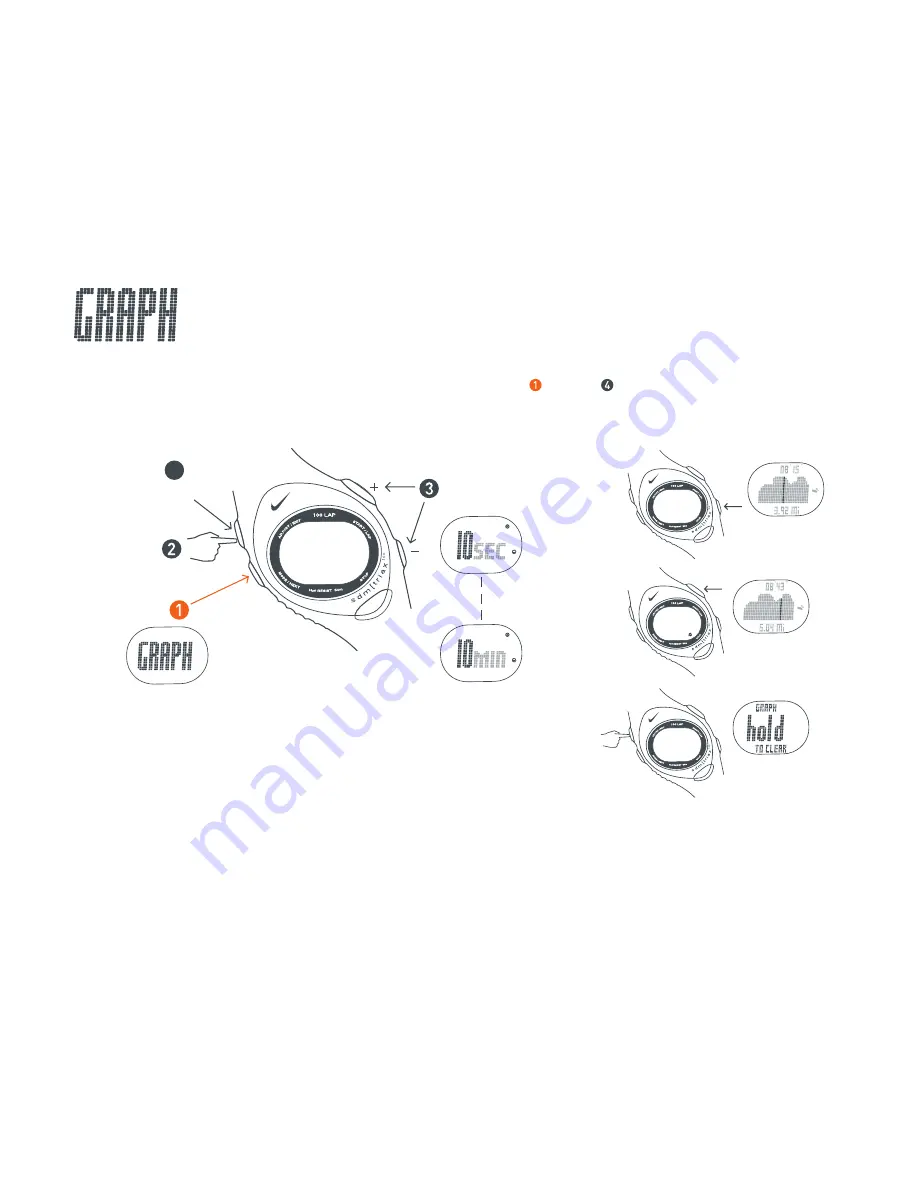
In GRAPH mode you can view a bar chart of Pace vs Time. Once the SDM Pod is turned on, GRAPH mode will begin plotting
your pace against your time based on a selected interval. Follow steps through to set the sampling interval.
View Graph of Pace vs Time
Scroll to
GRAPH mode
Press buttons
to adjust interval
4
4 SEC
EXIT
Press button to move
backwards through
the data points on graph
Press button to move
forwards through
the data points on graph
Clear Graph
Hold to clear all
graph data
4 SEC


