16
17
Some tests (like
Drop Jump
) have the possibility to view a
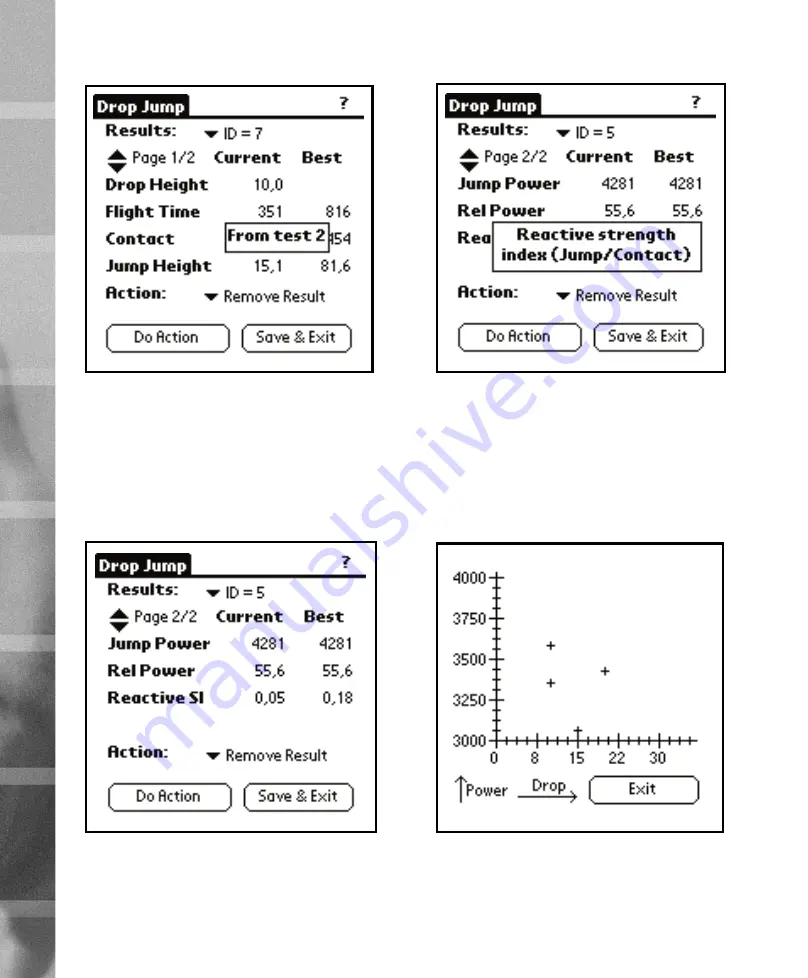
graph of the results. For that purpose the
Drop-Power Curve
action is present (other tests have different actions, depend-
ing on the curve type). Selecting that and tapping on the
Do
action view a graph that shows the
Drop Height
in the X-axis
and the
Jump Power
in the Y-axis. Example of this is shown in
Figure 29.
Removing invalid results
If a result is not satisfactory (bad jump etc.) it needs to be re-
moved so that it does not affect the statistics made with the
Powertimer Analyzer
. For this purpose the
Remove Result
ac-
Most tests have more calculated results that can be fitted into
one page. For that purpose, the
Page Selector
at the left side
below the
Results
label is provided. The up and down arrows
are used to change the page and the text beside the arrow
shows which page is currently visible and how many pages of
results there is. In case of
Drop Jump
there are two pages. Fig-
ure 27 shows the second page of
Drop Jump
results.
Tapping on a label that describes the contents of a row shows
a detailed pop-up description about the data shown in that
row. For example tapping on the
Reactive SI
label shows you
the pop-up shown in Figure 28.
Figure 26
Best result
pop-up
Figure 27
Page 2 of
Drop Jump
Figure 28
Result description pop-up
Figure 29
Drop-Power Curve
TE
ST
IN
G
3


