


2-14
|
ni.com
Chapter 2
Using the Module
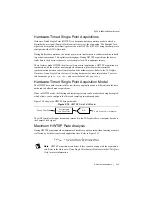
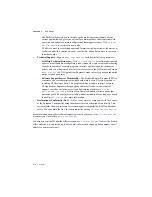
Figure 2-11.
Transfer Time and Application Time Relationship
Note
For control applications, it is important to consider the group delay of the data
being acquired and analyzed when calculating the control system bandwidth.
Regardless of the sample rate, the bandwidth of the system is as follows:
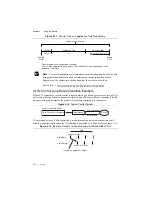
2 kHz Control Loop Rate Calculation Example
Figure 2-12 represents a typical control system in which you have a process to control, a DAQ
device to do the acquisitions and generate stimulus, and a PXIe controller or computer to do the
data processing and determine the proper AO value and returning it to the process.
Figure 2-12.
Typical Control System
To successfully close a 2 kHz control loop, make sure that the time between the time the AI
sample is acquired and the time the AO stimulus is generated is <500
μ
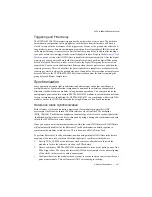
Figure 2-13.
Input and Output of a Control System with Bandwidth
≥
2 kHz
Tr
a
n
s
fer
Next
Sa
mple Filter Gro
u
p Del
a
y
Applic
a
tion Time
20
μ
s
*
120
μ
s
**
N
Sa
mple
Clock
Sa
mple
Clock
Ac
qu
i
s
ition R
a
te Period
W
a
it Time (Idle)
*Tr
a
n
s
fer time m
a
y v
a
ry depending on
s
y
s
tem.
**120
μ
s
i
s
the
a
pproxim
a
te gro
u
p del
a
y of the 2 kHz filter for inp
u
t fre
qu
encie
s
< 1 kHz
(p
assba
nd of the filter).
bandwidth
1
TransferTime ApplicationTime GroupDelay
+
+
-------------------------------------------------------------------------------------------------------------------------------
=
Control Loop Time, 500
μ
s
PXIe Controller or Comp
u
ter
Proce
ss
DAQ Device
AI Me
asu
rement
AO
S
tim
u
l
us
Tr
a
n
s
fer + Applic
a
tion < 500
μ
s
2 kHz Inp
u
t
2 kHz O
u
tp
u
t
Time
Sa
mple 0
. . .
Sa
mple 1
Sa
mple 0
. . .
Sa
mple 1


