USER MANUAL
S E M S
- 30 -
4.14. Measurement tools
In this section will be explained how to use all measurement tools in the software.
Please note that these tools will work independently from the chosen data source.
(Chapter 4.7)
4.14.1. Markers
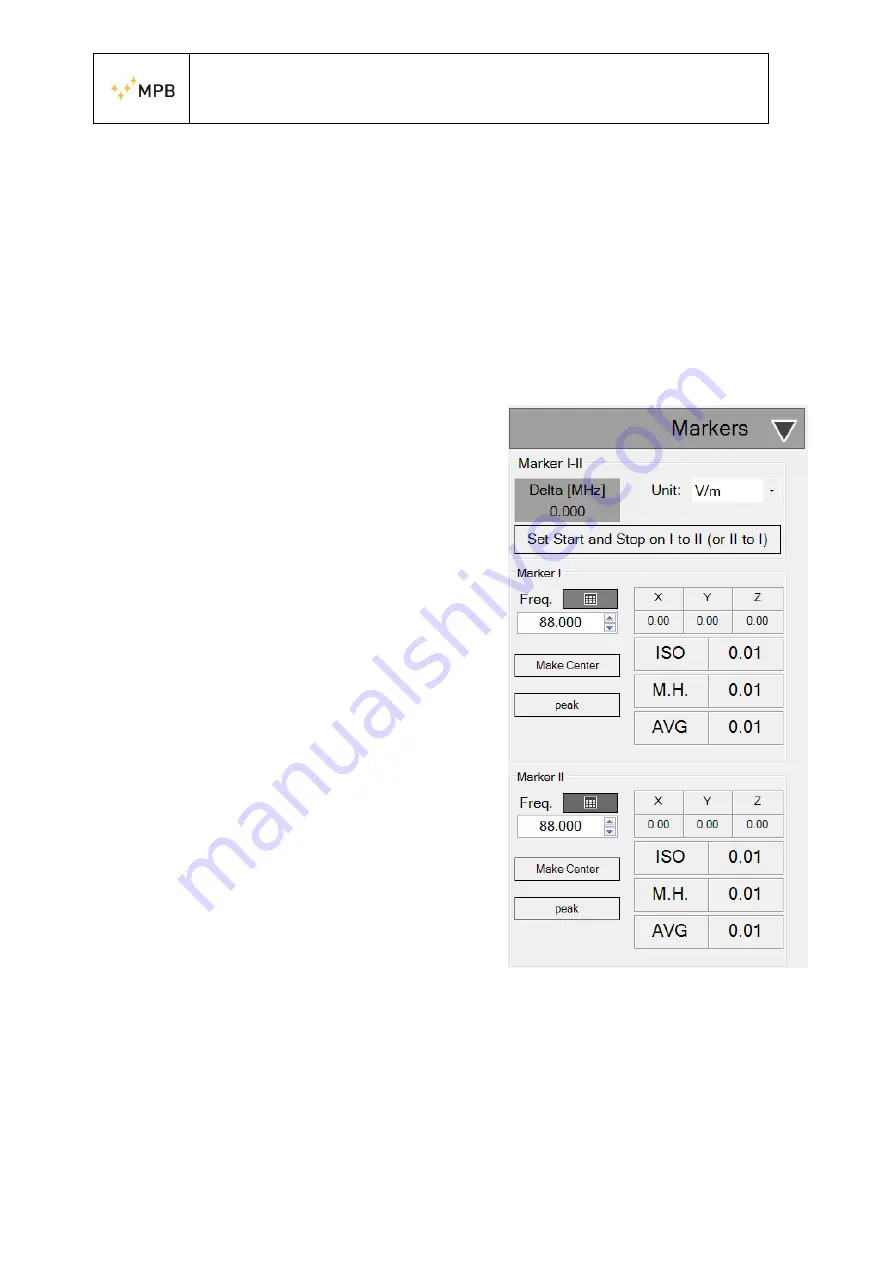
The “Markers” tab contains all the controls to move the graphic markers and read the
corresponding values for each track
In the tab is present a combobox, labelled
“Amplitude Unit”, that will edit the units of
measure of the detected values. From the panel it
is possible to set units of measure and choose the
preferred frequency from the dedicated space or
directly from the graph for each marker. It is also
possible from the graph to move the first marker
by left clicking and the second one by right
clicking. In case of default the tab will include the
value of the X,Y and Z axes and the Isotropic
one. If in the session the user has enabled the
“Max Hold” (4.13) visualization and/or the
“Average” acquisition mode, the “Markers”
panel will also show the values added in the
session. The next units of measure are available:
V/m
mV/m
W/
𝑚
2
mW/
𝑐𝑚
2
The “Peak” button will move the marker to the highest point of the track, the “Make
Center” will move the session frequency according to the marker position.
Figure 25Marker tab
Содержание SEP
Страница 16: ...USER MANUAL S E M S 16 c Link d Report e End Figure 6 Installer MPB SEP ...
Страница 25: ...USER MANUAL S E M S 25 Figure 19 Manage Configurations ...
Страница 44: ...USER MANUAL S E M S 44 Select Add a device Bluetooth Figure 33 Select RNBT xxxx ...
Страница 45: ...USER MANUAL S E M S 45 Figure 34 Accept the bluetooth association by clicking on connect Figure 35 ...
Страница 47: ...USER MANUAL S E M S 47 Figure 37 ...


