


C
ONTROL
C
HART
R
EPORT
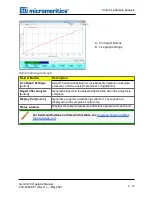
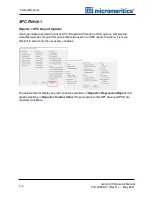
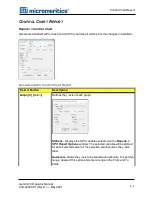
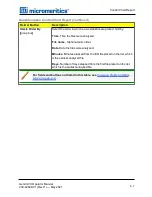
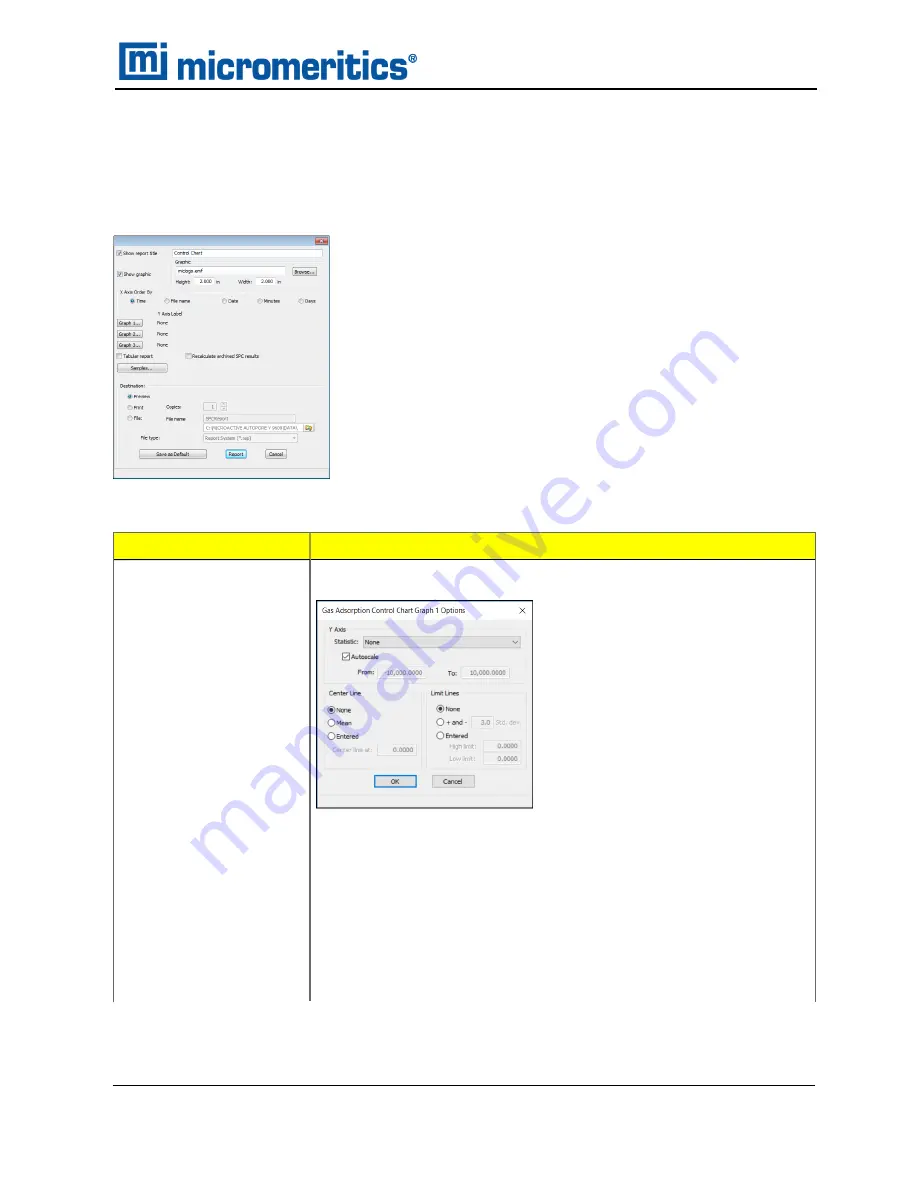
Reports > Control Chart
Generates a Statistical Process Control
(SPC)
chart report which plots the changes in a statistic.
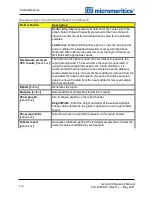
Field or Button
Description
Graph [
n
] [
button
]
Defines the y-axis of each graph.
Statistic.
Displays the SPC variables selected on the
Reports >
SPC Report Options
window. The selected variable will be plotted
for each selected sample. This selection also becomes the y-axis
label.
Autoscale.
Allows the y-axis to be scaled automatically. To specify a
range, deselect this option and enter a range in the
From
and
To
fields.
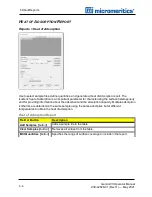
Gas Adsorption Control Chart Report
Control Chart Report
Gemini VII Operator Manual
239-42828-01 (Rev H ) — May 2021
6 - 5
Содержание GEMINI VII
Страница 1: ...OPERATOR MANUAL 239 42828 01 May 2021 Rev H GEMINI VII SURFACE AREA ANALYZER ...
Страница 10: ......
Страница 16: ......
Страница 92: ......
Страница 123: ...REPORT EXAMPLES BJH ADSORPTION REPORT Report Examples Gemini VII Operator Manual 239 42828 01 Rev H May 2021 6 31 ...
Страница 124: ...6 About Reports HORVATH KAWAZOE REPORT 6 32 Gemini VII Operator Manual 239 42828 01 Rev H May 2021 ...
Страница 125: ...ISOTHERM LINEAR PLOT REPORT Isotherm Linear Plot Report Gemini VII Operator Manual 239 42828 01 Rev H May 2021 6 33 ...
Страница 126: ...6 About Reports SAMPLE LOG REPORT 6 34 Gemini VII Operator Manual 239 42828 01 Rev H May 2021 ...
Страница 127: ...T PLOT REPORT t Plot Report Gemini VII Operator Manual 239 42828 01 Rev H May 2021 6 35 ...
Страница 128: ...6 About Reports VALIDATION REPORT 6 36 Gemini VII Operator Manual 239 42828 01 Rev H May 2021 ...
Страница 234: ......
Страница 242: ......
Страница 244: ......
Страница 247: ......
Страница 248: ......


