20
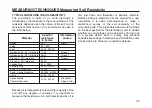
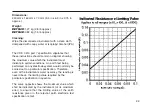
another curve can be plotted, as shown in Fig. 13 for
example.
Fig.13 Possible results from several Slope method
tests.
This shows how the resistance is decreasing as the
distance chosen for EC is increased.
The curve indicates that the distances chosen for EC in
tests (1) and (2) were not large enough, and that those
chosen in tests (3) and (4) were preferable because
they would give the more correct value of the earth
resistance.
(iii) It is unreasonable to expect a total accuracy of
more than 5%. This will usually be adequate, bearing in
mind that this sort of variation occurs with varying soil
moisture conditions or non-homogeneous soils.
MEASURING TECHNIQUES Testing Earth Electrodes
Содержание DET5/4D
Страница 41: ...41...


