background image

Advanced Topics

34

4.

Press 

R

 to return to the graphic view, and then press 

EXPORT

 to export 

data to the Statistics application using the new filtering methods. 

The export options are the same as the options for display filtering, with two 

additions. The additional options are summarized in Table 4-2.

Data history

By default, StreamSmart 410 collects data from a single sensor at approximately 

5,000 samples per second while streaming. At this rate, the StreamSmart Aplet 

can collect approximately 16.5 seconds of data before memory is full. You can use 

the options in the 

Experiment

 menu to increase the time allotted to an experiment, 

or you can change the way the StreamSmart Aplet allocates memory to data 

streams via the 

History

 field in the second page of the 

Plot Setup

 menu. Press 

@


R


%%@PAGE#]p{px]%

 to access this menu. Figure 4-29 illustrates the second page of 

the 

Plot Setup

 menu with the 

History Type

 field highlighted. By default, this field 

is set to 

Fixed

, meaning that the StreamSmart Aplet will store all data collected 

during streaming for a fixed amount of time. The amount of time will vary, 

depending on the number of sensors in use. The current duration (in seconds) is 

shown in the 

History

 field. In this case, streaming can continue for a total of 

16.453 seconds before earlier data is dropped. You can change the 

History 

Type

 from 

Fixed

 to 

Auto

 by pressing 

!CHOOS

 and selecting the 

Auto

 option (see 

Figure 4-30). If the 

History Type

 is set to 

Auto

, then data will be saved 

indefinitely, but less and less of the earlier data is kept.
In either case, you can start data streaming and just let it run indefinitely. The 

Fixed

 option simply drops data older than the 

History

 value, while 

Auto

 thins 

the older data to make room for new data.

Table 4-2 Additional export filters

Name Description

Auto

This is the default option. It matches the export filter to the display filter.

WYSIWYG

This option filters the data so that the scatter plot in the Statistics 

application matches the graph in the StreamSmart Aplet exactly. The 

results of this filtering depends on your zoom level.

Figure 4-29 Plot Setup Menu, page 2 

Figure 4-30 Select History Type

Содержание HP 410

Страница 1: ...HP StreamSmart 410 User Guide For use with the HP 39 40gs Graphing Calculators HP Part Number NW241 90001 Edition 3 January 201 1 ...

Страница 2: ...ditorial errors or omissions contained in the manual Hewlett Packard Company shall not be liable for any errors or for incidental or consequential damages in connection with the furnishing performance or use of this manual or the examples contained herein Copyright 201 1 Hewlett Packard Development Company L P Reproduction adaptation or translation of this manual is prohibited without prior writte...

Страница 3: ...a from Events 21 Numeric view the meter mode 23 Set up experiment 23 Monitor and select events 25 Analyze the data 26 Data logging 26 4 Advanced Topics 27 Sensor setup manually identify a sensor 27 Unit setup manually select units for a sensor 28 Calibration 29 Filtering data for display and export 32 Data history 34 Oscilloscope mode 35 StreamSmart 410 and the virtual calculators 36 Keyboard shor...

Страница 4: ...ave apart into separate microphones the HP MCL displays their voice sound waves live so their wavelengths can be compared Stream select events Same as above StreamSmart captures the dampened oscillations of a vibrating rod Students select just the maxima of the oscillations for further analysis Selected events Displays a live meter read out for up to four sensors simultaneously you can add a set o...

Страница 5: ...creen be sure to charge the StreamSmart 410 as soon as possible I 2 Connect Connect a Fourier sensor to the StreamSmart 410 using the sensor cable The following experiment uses the Fourier light intensity sensor but you can use any sensor and still follow along with this guide Note the sensor cable ends have a flat side be sure the flat side faces up on the connection to the StreamSmart 410 Connec...

Страница 6: ...the HP 39 40gs The user runs the HP Mobile Calculating Laboratory via the StreamSmart Aplet Please check online at www hp com calculators to ensure you have the latest version of the StreamSmart Aplet See Figure 1 2 below for instructions on accessing the application Figure 1 2 The StreamSmart Aplet on the HP 39 40gs ...

Страница 7: ...rt When this message appears press the START menu key to commence data streaming The data stream is a graphical representation of sensor data The horizontal axis represents time in seconds and the vertical axis represents sensor data in units of measurement The plot window displays a number of items as illustrated in Figure 1 3 below Figure 1 3 The Plot Window for the HP 39 40gs ...

Страница 8: ...aming Experiments for details Figure 1 5 Numeric View Numeric S View up to four sensors numerically in a meter Perform selected events and events with entry experiments See Chapter 3 Capturing Data from Events for details Figure 1 6 Plot Setup pg 1 Plot Setup page 1 R Optional set up the window for the graphic view of the data stream Optional choose stacked display of multiple data streams or over...

Страница 9: ...mSmart 410 views View Name Key s Description Figure 1 9 Unit Setup Unit Setup Activate deactivate channels Select a unit of measurement for sensors with multiple units of measurement available Figure 1 10 Calibrate Calibrate Select a sensor s channel for software calibration of the sensor Perform 1 point or 2 point software calibration of the selected sensor Figure 1 1 1 Experiment Experiment Perf...

Страница 10: ...ion column for each sensor s data or use the default values provided When you export data to the Statistics Aplet you can choose to follow your data into the Statistics application for analysis or stay in the StreamSmart Aplet to continue experimentation In depth analysis of the data including the calculation of summary statistics for 1 or 2 variables and modeling bi variate data with various fits...

Страница 11: ...y below the screen display There are six of these menu keys in all For example in the Plot screen capture in Table 1 2 the four items shown in the menu are CHAN PAN SCOPE and STOP These keys are represented in a special font For example ZOOM appears as ZOOM 3 The StreamSmart Aplet also employs dialogue boxes from time to time as shown in the Streamer Plot Setup view in Table 1 2 above The field na...

Страница 12: ... START for a new data stream The OK menu key is interchangeable with the key the CANCL menu key and the key are also interchangeable When navigating a list of options in a menu use the alphabetical keys to jump to your choice For example press 7 to jump to the first item in the list that starts with the letter P Press 7 again to cycle through the next option that starts with P Use to navigate list...

Страница 13: ...you can modify how you view the stream s You can speed the streams up or slow them down simultaneously as all four streams share the same horizontal time axis In addition you can move each stream up or down separately and zoom in or out on each stream vertically Each stream has its own vertical axis Zooming and panning each stream separately in the vertical dimension allows you to get just the rig...

Страница 14: ... a new stream Display Description Figure 2 3 Select page 1 How I got there Press STOP EXPRT What I see on screen Data streams Current channel and sensor with tracer active Selected data set based on the current channel and the number of data points ready for export Current tracer coordinates What I can do ZOOM PAN and TRACE to navigate the data streams and find data of interest CROP LEFT and CROP ...

Страница 15: ...wn box to choose a destination column in the Statistics application for that channel s data A checkbox to choose between staying in the StreamSmart Aplet after data export or following your data into the Statistics application What I can do CHK select or deselect each channel for data export CHOOS select destination columns for the data from each sensor CANCL to return to the original data set or ...

Страница 16: ...zoom in horizontally on the streams essentially making each pixel represent a smaller and smaller set of data points or zoom out making each pixel represent a larger and larger data set By default the StreamSmart Aplet uses the average of these data points to represent the entire set In other words StreamSmart filters the data by using averages However you can choose other filtering methods For ad...

Страница 17: ...eams uniformly panning vertically affects only the current selected stream ZOOM Used with the direction keys zooms in or out horizontally or vertically to get the best view of the streams Zooming horizontally affects all streams uniformly while zooming vertically affects only the current selected stream SCOPE Switches to oscilloscope mode In this mode the data stream sweeps from left to right then...

Страница 18: ...e tracer position effectively decreasing the amount of time represented by the width of the display Press Z to zoom out horizontally on the tracer position effectively increasing the amount of time represented by the width of the display ZOOM W X Zoom in out vertically on the current selected data stream Press W to zoom in and press X to zoom out The center of the display stays fixed Decreases inc...

Страница 19: ...he dampened oscillations of a vibrating rod In this case you may want to collect just the maximum of each oscillation into a data set Press SETUP to choose columns in the Statistics application for your data Once the columns have been chosen return to your data stream and trace to the first point you want to keep in your data set Press ADD to add the data as a row to your chosen columns in the Sta...

Страница 20: ... off the left and right sides of the data set as shown in Figure 2 1 1 You can also thin the data by subtracting points if you change your mind you can add them back Table 2 5 and Table 2 6 describe the new functions available on the two pages of the Export menu Figure 2 10 The Low Battery Symbol Figure 2 1 1 The Cropping Tools Table 2 5 Export Data Menu Keys page 1 Menu Key Description nn Toggles...

Страница 21: ...CHK to toggle between selecting and deselecting a channel Each channel field is also followed by a dropdown box This dropdown box permits you to choose the column in the Statistics application you want as the destination for the data from that channel Press the CHOOS menu key to change the current column to any of the ten columns in the Statistics application At any time you can press CANCL to ign...

Страница 22: ... in a table Although only four columns are displayed there are actually ten columns available Use Y and Z to move from column to column use X and W to navigate through the data in a column One key to understanding the Statistics Aplet is the 1VARqqq 2VARqqq menu key Press this key to toggle between 1 variable and 2 variable statistics If set to 1VARqqq you are studying the data column by column if...

Страница 23: ...s Press Q Plot Setup to select a fit model for each scatter plot The easiest way to see a graph of your data is to press V and select the Autoscale option If your graph is a scatter plot press MENU and then FIT to see the fit model plotted with your data The views of the Statistics Aplet are summarized in Table 2 8 and Table 2 9 For more information please refer to your HP Calculator s user guide ...

Страница 24: ...lated sample readings from up to four sensors at a time and collect them into a data set for analysis The StreamSmart Aplet lets you capture data at any point in time and have the data exported to corresponding rows of separate columns in the Statistics application Additionally you can have the readings auto numbered in the order in which they are collected or you can add a numerical entry to each...

Страница 25: ...en Up to four sensors and their units Current readings What I can do ADD add a reading to the current data set SETUP select experiment type and destination for data SENSOR manually identify a channel s sensor UNIT change units of measurement for a sensor STAT go directly to the Statistics application to view and analyze the current data set Figure 3 4 Analyze Data How I got there Press STAT What I...

Страница 26: ...e StreamSmart 410 The readings will be auto numbered and this number will be stored in Row 1 of column C1 in the Statistics application The rest of the readings will be stored in Row 1 of columns C2 through C5 with the reading from the sensor in Channel 1 stored in Figure 3 5 The Numeric View Table 3 2 lists the menu items in the Numeric View Table 3 2 Menu keys in the Numeric View Menu Key Descri...

Страница 27: ...ield that controls what happens each time you press ADD Here you can choose whether to simply collect the data from the sensors auto number each reading or add a numeric entry to each reading If you choose to add a numeric entry to each reading this menu also has a fifth field ENTRY that determines the column where these numeric entries are stored Table 3 3 lists the items in the Capture Events me...

Страница 28: ...o accept all your changes at any time or the CANCL menu key to cancel all changes either way you will return to the Numeric view Monitor and select events Once you have activated the proper channels and set destinations for the data from these channels you are ready to begin collecting data Of course you can always just start by collecting data using the default columns To capture an event just pr...

Страница 29: ...e Views menu as illustrated in Figure 3 12 and Figure 3 13 1 Press V Experiment to enter the Experiment menu 2 Set LENGTH to 3 seconds and SAMPLES to 50 3 Press OK to trigger data collection Data collection is shown as a time graph just like a streaming experiment However StreamSmart collects 50 discrete sets of sensor readings in a 3 second period at a uniform frequency of 1 reading every 0 06 se...

Страница 30: ...is case you must manually identify the sensor using the Sensor Setup dialog box Press V and select the Sensor Setup option Figure 4 2 shows the Sensor Setup dialog box with accelerometers plugged into Channels 1 and 2 Suppose that the sensor in Channel 1 is not an accelerometer but a force sensor With Channel 1 highlighted press CHOOS and select the appropriate force sensor option In Figure 4 3 th...

Страница 31: ...nit Setup dialog box Press V and select the Unit Setup option to open the Unit Setup dialog box In the Numeric view on the HP 39 40gs you can simply press UNIT Figure 4 6 shows the Unit Setup dialog box with a force sensor measuring Newtons in Channel 1 and an accelerometer measuring g s g 9 8 m s2 in Channel 2 Note that Channel 2 in Figure 4 6 is highlighted Suppose you wish the accelerometer to ...

Страница 32: ...econd since the calibration is in the software it will be applied to all sensors of that same type The StreamSmart Aplet cannot distinguish between two sensors of the same type Once it has been determined that software calibration for a sensor is the only option it should be noted that the StreamSmart 410 offers both 1 point and 2 point methods for such calibrations A 1 point calibration simply ch...

Страница 33: ...cess The Plot Setup menu The Plot Setup menu gives you access to a number of advanced options for streaming experiments Among these are overriding the default streaming window settings and the default data filtering methods Setting the stream window In most cases you will use the zoom and pan features to match the display dimensions to the set of data points you find interesting In some cases howe...

Страница 34: ...the StreamSmart Aplet is reset Plot display options When performing experiments with multiple sensors the StreamSmart Aplet places each data stream in its own swim lane by default The data streams appear in the numerical order of their channels from top to bottom of the display Under certain circumstances you may want to see multiple data streams superimposed instead of separated in swim lanes In ...

Страница 35: ... filtering options available During data streaming each pixel in the display represents an interval of time and all the sample readings collected during that time interval For example Figure 4 22 shows the tracer at the pixel whose center is at 6 9 seconds As stated previously all the data collected between x 6 85 seconds and x 6 95 seconds have been represented by the average of those readings wh...

Страница 36: ...he Display Filter field of the Plot Setup menu In the same way that data is filtered for display in the StreamSmart Aplet it is also filtered for export to the Statistics application To choose an export filtering method 1 Press R to enter the Plot Setup menu and use the X key to highlight the EXPORT FILTER field 2 Press the CHOOS menu key to see the list of options 3 Use X and W to highlight your ...

Страница 37: ...at the StreamSmart Aplet will store all data collected during streaming for a fixed amount of time The amount of time will vary depending on the number of sensors in use The current duration in seconds is shown in the History field In this case streaming can continue for a total of 16 453 seconds before earlier data is dropped You can change the History Type from Fixed to Auto by pressing CHOOS an...

Страница 38: ...g trigger starts the sweep when the data values first drop below the trigger value The operation of the trigger mechanism assures that when the triggering value is reached the first data point is plotted where the dotted trigger lines intersect You can also set a two way trigger While in Oscilloscope mode the zoom and pan features both work as they do during data streaming The result is that you c...

Страница 39: ...omputer launch the HP 39 40gs Virtual Graphing Calculator application and start the StreamSmart Aplet For further information regarding the HP 39 40gs Virtual Graphing Calculator software for your computer please visit www hp com calculators Table 4 4 Oscilloscope menu keys page 2 Menu Key Description ooooooo Sets a two way trigger that operates whether it is crossed from below or above Use the di...

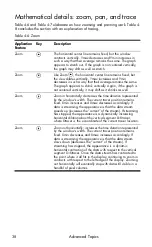
Страница 40: ... or after streaming Zooms out vertically during or after streaming Zooms in horizontally during or after streaming Zooms out horizontally during or after streaming ƒ Adds ten points to the currently selected data set while in the Export menu ƒ Subtracts ten points from the currently selected data set while in the Export menu A Opens the Sensor Setup menu B Opens the Unit Setup menu E After one or ...

Страница 41: ...by the window s width The current tracer position remains fixed Xmin increases and Xmax decreases accordingly If data is streaming the appearance is that the data stream speeds up increases the current of the stream If streaming has stopped the appearance is a dynamically increasing horizontal dilation about the vertical segment X Xtracer where Xtracer is the x coordinate of the current tracer loc...

Страница 42: ... are decreased by equal amounts Pan Z Moves the stream to the left The values of Xmin and Xmax are increased by equal amounts Application Feature Key Description Trace Y Moves the trace cursor along the data stream from pixel to pixel to the right The values of X Min and X Max only change if the cursor traces beyond the right edge of the display Trace Z Moves the trace cursor along the data stream...

Страница 43: ... need to charge the unit for approximately five hours Your computer must be running for charging to occur DO NOT use the cable attached to the StreamSmart 410 for charging WARNING Do not try and replace the battery pack The battery pack is not removable If you have problems charging the unit contact the manufacturer using the contact information listed below If handled improperly batteries can bur...

Страница 44: ...rrant that the operation of HP products will be uninterrupted or error free If HP is unable within a reasonable time to repair or replace any product to a condition as warranted you will be enti tled to a refund of the purchase price upon prompt return of the product with proof of purchase HP prod ucts may contain remanufactured parts equivalent to new in performance or may have been subject to in...

Страница 45: ... notice This device complies with Part 15 of the FCC Rules Operation is subject to the following two conditions 1 this device may not cause harmful interference and 2 this device must accept any interference received including interference that may cause undesired operation Canadian Notice This Class A digital apparatus meets all requirements of the Canadian Interference Causing Equipment Regulati...

Страница 46: ...HQ TRE Herrenberger Strasse 140 71034 Boeblingen GERMANY Japanese Notice Korean Notice For non telecommunications products and for EU harmonized telecommunications products such as Bluetooth within power class below10mW For EU non harmonized telecommunications products If applicable a 4 digit notified body number is inserted between CE and ...

Страница 47: ...r hardware warranty your HP calculator also comes with one year of technical support If you need assistance with warranty please refer to the warranty information on the product CD HP customer care can be reached by either email or telephone Before calling please locate the call center nearest you from the list provided Have your proof of purchase and calculator serial number ready when you call T...

Страница 48: ...λάδα 210 969 6421 Grenada 1 800 71 1 2884 Guadelupe 0 800 990 01 1 800 71 1 2884 Guatemala 1 800 999 5105 Guyana 159 800 71 1 2884 Haiti 183 800 71 1 2884 Honduras 800 0 123 800 71 1 2884 Hong Kong 香港特別行 政區 800 93301 1 Hungary www hp com support India 1 800 1 14772 Indonesia 21 350 3408 Ireland 01 605 0356 Italy Italia 02 754 19 782 Jamaica 1 800 71 1 2884 Japan 日本 00531 86 001 1 Kazakhstan www hp...

Страница 49: ...www hp com support Singapore 6272 5300 Slovakia www hp com support South Africa 0800980410 South Korea 한국 00798 862 0305 Spain España 913753382 St Kitts Nevis 1 800 71 1 2884 St Lucia 1 800 478 4602 St Marteen 1 800 71 1 2884 St Vincent 01 800 71 1 2884 Suriname 156 800 71 1 2884 Swaziland www hp com support Sweden Sverige 08 5199 2065 Switzerland 022 827 8780 Switzerland Suisse Français 022 827 8...

Страница 50: ...161 Uruguay 0004 054 177 US Virgin Islands 1 800 71 1 2884 United States 800 HP INVENT Venezuela 0 800 474 68368 0 800 HP INVENT Vietnam Viêt Nam 65 6272 5300 Zambia www hp com support Country Region Contact Country Region Contact ...

Страница 51: ...iew numerically 12 E Experiment types events with entry 24 logging 26 selected events 21 streaming 10 F Filters display 32 export 32 H Helpful hints 9 K Keyboard shortcuts 37 M Manual conventions 8 Mark and swap 16 Meter mode 23 O Oscilloscope mode 35 P Pan 14 R Regulatory Information 42 S Sensor 27 calibration 29 change sensor units 28 manually select sensor 27 statistics application 7 20 Swap an...

Страница 52: ...Index ...

Отзывы: