Advanced Topics
30
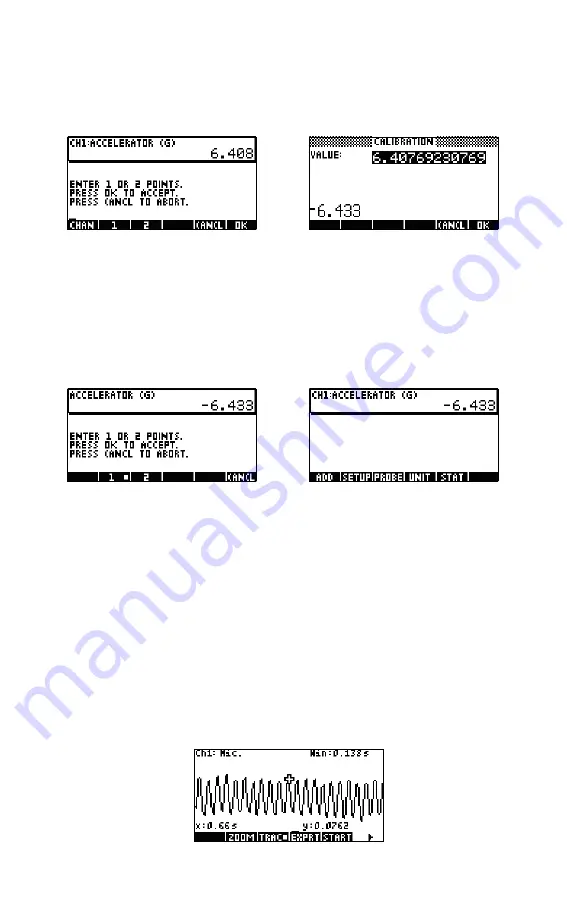
sensor values. Press
%1$
to enter the correction for the current reading. The
current reading is still
6.408
, but it should read
-6.433
. Enter the correct
value as shown in Figure 4-13 and press
$OK#
to return to the calibration
screen.
4.
Note that the calibration change is not yet effective, as you have the option
of entering a second correction. The white square in the
%$1!!qqq!!!
key in
Figure 4-14 indicates that the first point correction has been logged.
5.
Press
$2$
to enter a second point correction, or press
$OK#
to make the 1-
point calibration effective (Figure 4-15). Of course, you can press
CANCL
to
abort the calibration process.
The Plot Setup menu
The
Plot Setup
menu gives you access to a number of advanced options for
streaming experiments. Among these are overriding the default streaming window
settings and the default data filtering methods.
Setting the stream window
In most cases, you will use the zoom and pan features to match the display
dimensions to the set of data points you find interesting. In some cases, however,
you may want to see all the data between two known time values. Suppose you
have been collecting data from a microphone for a few seconds (see Figure 4-16)
and you wish to look at the data from time t=0.85 seconds to time t=0.95 seconds.
Figure 4-16 Collected Data in Streaming Window
Figure 4-12 Calibration Screen
Figure 4-13 Enter the Correct Value
Figure 4-14 First Point Correction Logged
Figure 4-15 1-Point Calibration Effective
Содержание HP 410
Страница 52: ...Index ...


