Advanced Topics
32
Filtering data for display and export
Under most circumstances, each pixel in the display of the data stream represents
multiple sensor readings. Depending on the current window, each pixel could
represent quite a large data set. For example, in Figure 4-22, each pixel has a
width of approximately 0.1 seconds (13s/130pixels=0.1s/pixel). But StreamSmart
410 has collected approximately 570 readings in each 0.1 second interval. For
display purposes, those 570 readings are represented by a single value. In
Figure 4-22, the readings taken from 6.85 seconds until 6.95 seconds have been
averaged to obtain a reading of
0.578
. The pixel containing the point (6.9,
0.578) has been turned on to represent that set of readings.
As you zoom out, each pixel represents a larger and larger set of readings.
Zooming in makes each pixel represent a smaller and smaller set of readings until,
when you have zoomed all the way in, each pixel finally does represent a single
reading. This is fundamental to the StreamSmart solution to data collection: the full
data set is available to the user and is only filtered for display and export purposes.
Since the data goes through these two distinct filters before it gets to the Statistic
application, the advanced user benefits from understanding the default filtering
process and the other filtering options available.
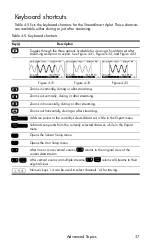
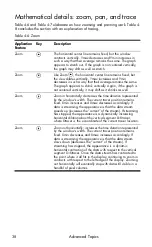
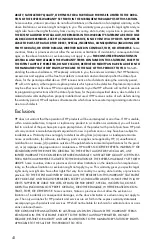
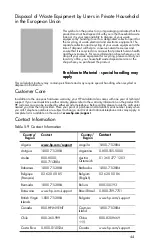
During data streaming, each pixel in the display represents an interval of time and
all the sample readings collected during that time interval. For example, Figure 4-
22 shows the tracer at the pixel whose center is at 6.9 seconds. As stated
previously, all the data collected between x=6.85 seconds and x=6.95 seconds
have been represented by the average of those readings, which is 0.578. Figure 4-
23 shows all the data between x=6.9 seconds and x=7.0 seconds. All that data is
equivalent to the data represented by a single pixel in Figure 4-22! Only when the
StreamSmart Aplet has zoomed all the way in on a set of data is there a 1:1
correspondence between pixels and data points.
The default display filter uses the numerical average of the readings in an interval
to represent that set of readings. When you export the data to the Statistics
application, the StreamSmart Aplet uses the same values that the display used. This
method ensures that the export filter is the same as the display filter.
The StreamSmart Aplet has a number of different filtering options for both display
and export purposes. Figure 4-24 shows the data stream in Figure 4-22 filtered by
the average of each pixel set. Figure 4-25 shows the same data set filtered by the
minimum of each pixel set, while Figure 4-26 is filtered by the maximum. The
oscillations hidden in Figure 4-22 and exposed by zooming in Figure 4-23 can
also be seen in Figure 4-25 and Figure 4-26, this time exposed by the filtering
Figure 4-22
Figure 4-23
Содержание HP 410
Страница 52: ...Index ...


