31
32
Fig
8
.
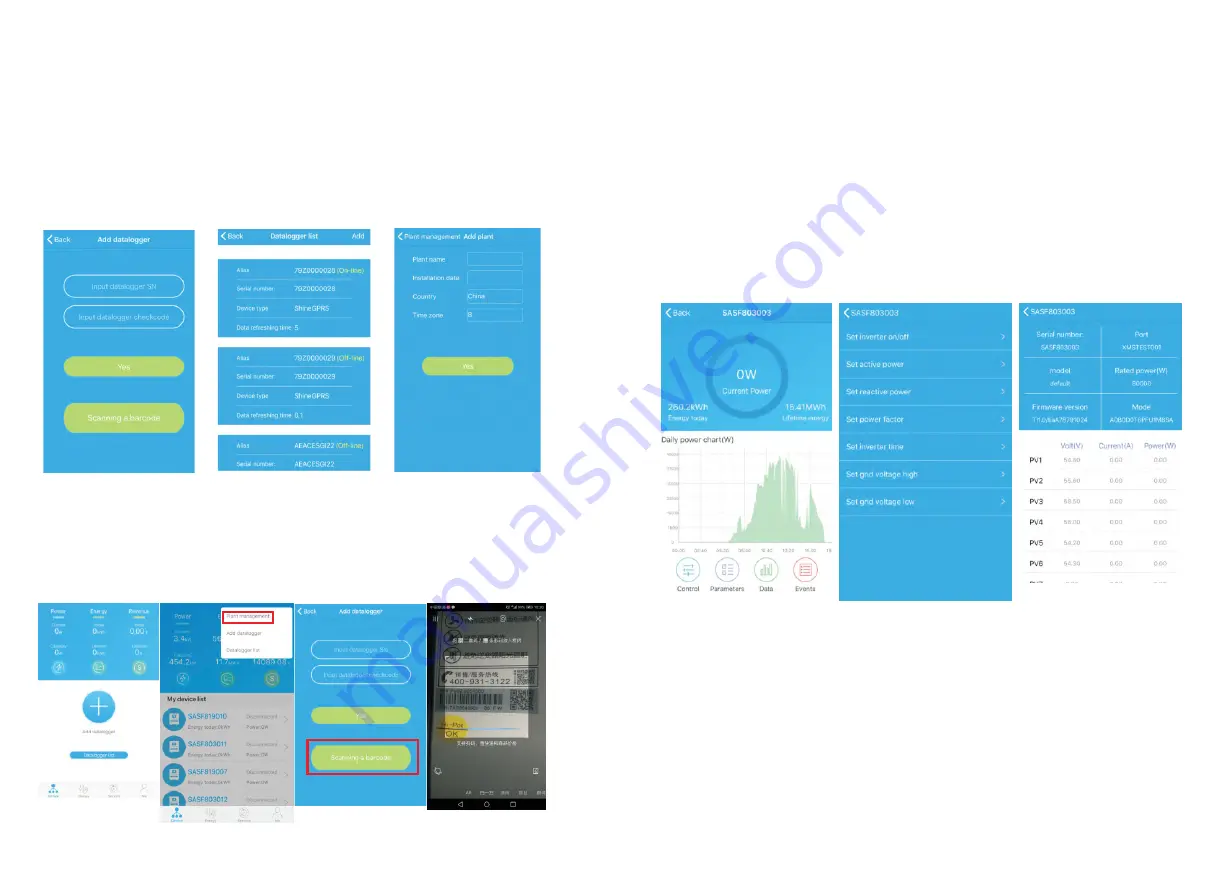
4 add datalogger
Fig
8
.
5 datalogger
list
Fig
8
.
6 add
plant
Datalogger
:
1>User
can
add
more
datalogger
under
the
particular
plant
.
Way
:
Click “+” in the upper right corner of the device page and select “Add Collector
(WiFi/GPRS, etc.)”, as shown in Figure 8.7.
Note: You can choose to manually enter the collector serial number for addition, or you
can add it by scanning the barcode on the nameplate.
Device
page
:
1>Main
page
top
middle
is
the
name
of
current
plant
,
user
can
click
the
"∨"
button
to
switch
to
other
plants
under
this
account
.
2>User
can
add
datalogger
,
check
datalogger
and
add
plant
by
click
“+”
button
at
the
top
right
corner
.
3>Top
half
shows
current
plant
power
,
revenue
today
and
total
production
.
4>My
device
list
shows
current
plant
device
,
user
can
see
more
details
by
click
the
device
,
left
cross
the
device
to
stick
the
device
and
edit
,
edit
operation
includes
change
device
alias
,
icon
,
and
delete
device
.
Fig
8
.
7
2>User
can
add
datalogger
at
the
datalogger
list
page
to
add
a
datalogger
,
edit
,
delete
,
configure
etc
.
3>User
can
add
more
plants
with
the
add
Plant
function
.
Device
page
and
function:
1>Device
page
:
User
can
click
the
device
to
see
more
details
,
the
device
page
show
current
power
and
Energy
today
and
daily
power
chart
,
user
can
find
more
with
control
,
parameter
,
data
and
Events
page
.
2>Control
:
user
set
inverter
on
/
off
,
set
active
power
,
set
reactive
power
,
set
PF
,
set
inverter
time
,
set
grid
voltage
high
,
set
grid
voltage
low
.
The
operation
password
is
:
inverter
+
date
,
for
example
inverter20170722
.
3>Parameter
:
user
can
see
device
SN
,
rated
power
,
firmware
version
,
PV1
voltage
,
current
,
and
power
etc
.
Fig
8
.
8
Fig
8
.
9
Fig
8
.
10
4>Data
page
:
user
can
see
the
PV
power
,
voltage
,
current
,
R
phase
power
,
S
phase
power
,
S
phase
power
,
T
phase
power
,
output power
by day
,
month
,
year
,
by
finger
up
cross
the
screen
.
5>Events
:
User
can
see
the
fault
message
if
there
it
is
.


