


28
Geonics Limited
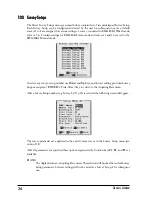
are monitored with the update rate of approximately 10 times per second. In this mode the operator
can monitor the instrument output (without recording the data), GPS parameters (if Enabled), as
well as change the operation to the Logging mode, and access several field options. In the Logging
mode when the EM61-MK2 data is recorded in the data file, field options can not be accessed.
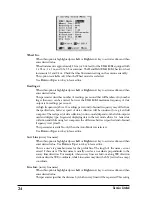
When the Log Data menu is displayed for the first time it appears always in the Stand By mode.
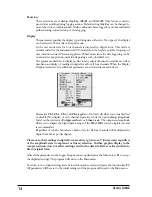
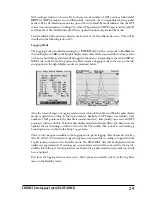
Stand By mode
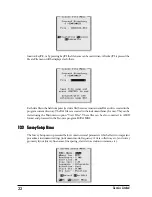
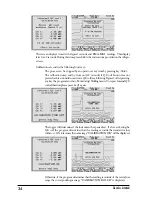
The Log Data menus in two display modes, in the text mode (on the left) and in the graphic mode
(on the right) are presented below.
The main portion of the screen in the graphic mode is occupied by the plot area. Readings in the
plot area can be displayed in compressed amplitude scale (recommended and shown in this manual
figures), which corresponds to Square Root of the amplitude. In compressed amplitude scale 0 to
100 corresponds to 0 to 10,000 mV, and compressed range 0 to 200 corresponds to 0 to 40,000 mV.
Plotting data in compressed amplitude allows to show details in the low range of amplitude, as well
as relatively good resolution in the high range of data on the small screen.
Please note, that data
displayed in the digital form are always given in the standard, linear scale.
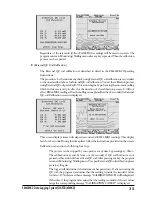
The amplitude
scale is divided by four or five dotted grid lines. In the case where the amplitude scale starts with a
negative value, then the grid line corresponding to zero is always plotted as a solid line.
Readings for channels
1
,
2
,
3
, and
4
(or
T
) are shown in digital form in the central portion of the
screen in the text mode, and below plot area in the graphic mode. The EM61MK2A program
prepared for the Allegro field computer, displays labeled channels in graphic mode. Units (mV) are
not displayed in the graphic mode. If program EM61MK2P is used in graphic mode labels are not
displayed due to smaller screen in Pro4000. Values of readings are displayed in the following order
(from the left): Channel 1, 2, 3, and 4 (or T).
Both modes show the log file name and optional GPS parameters. Name of the Log Data menu
mode is displayed in the text mode, and it is shown as an abbreviation in the top right corner of the
screen in graphic mode, STB for Stand By mode, and LOG for logging mode. The instrument
battery level (Bt) is updated continuously (in Volts) in both modes.
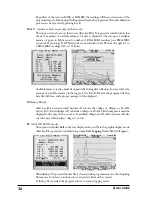
Current survey line name and station number is displayed at the top of the screen. In the Stand By
mode the station number will not change. Stations in the EM61MK2A program are incremented
by 1 or station increment value after each reading is written to the data file.
Similarly, the stations with the GPS readings (assuming that the GPS is connected to the logger)
remain the same in the Stand By mode. Number of GPS positions is incremented by 1 after each
Содержание EM61MK2A
Страница 2: ......


