16
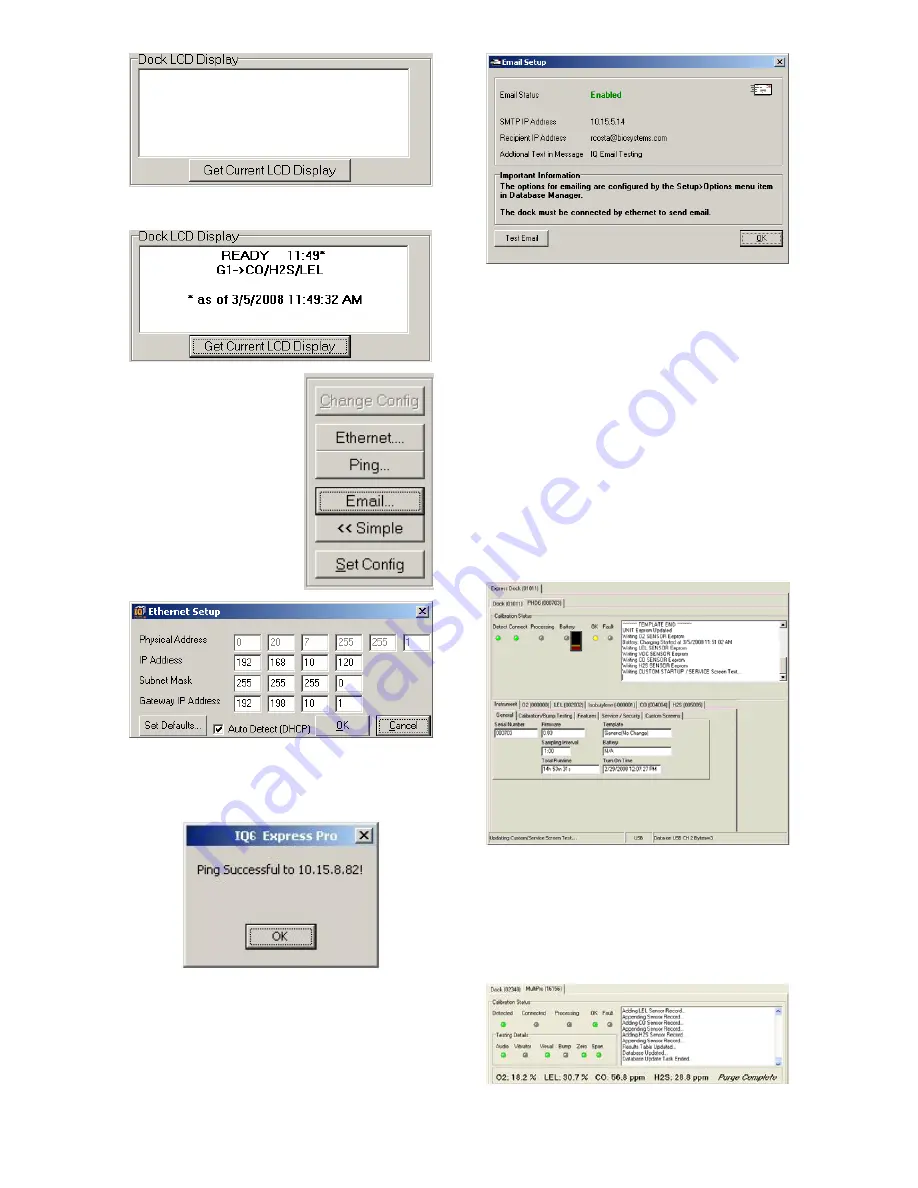
To view the dock’s Display, click on “Get
Current LCD Display”.
Ethernet Controls
For docks that are
connected by
Ethernet, there are
three additional
controls on the lower
right corner of the
display: Ethernet,
Ping and E-mail.
To view the Ethernet
settings, click on the
Ethernet button.
To test the dock connection, press the
Ping button. A status window will be
shown to indicate whether the ping was
successful or not.
The dock’s e-mail settings are controlled
through the Database Manager Pro
program, but can be viewed by clicking
on the e-mail button. The e-mail status,
IP Address of the dock, recipient e-mail
address and text of the e-mail message
are shown.
To test the e-mail ability of the dock,
press the Test E-mail button at the lower
left. An e-mail will be generated and sent
to the recipient e-mail address that is
listed.
Press OK to close the Email Setup
window.
3.2.2 PHD6 Tab
The PHD6 tab shows instrument
information for the detector that is
currently in the dock. The right side of
the tab is identical to the Dock Status tab
section discussed above. The blank
space at right is an output box that
shows detailed instrument information as
it is processed.
The output box is updated as the
instrument is detected, connected, and
processed. When faults occur, the
details of the fault will be shown and a
red fault light will be shown. Below, a
span calibration failure is the cause of
the fault.
If the datalogger has been downloaded,
the “View Session Data” control will


