


12
Indicators section of the IQ Ethernet
Instructions Booklet.
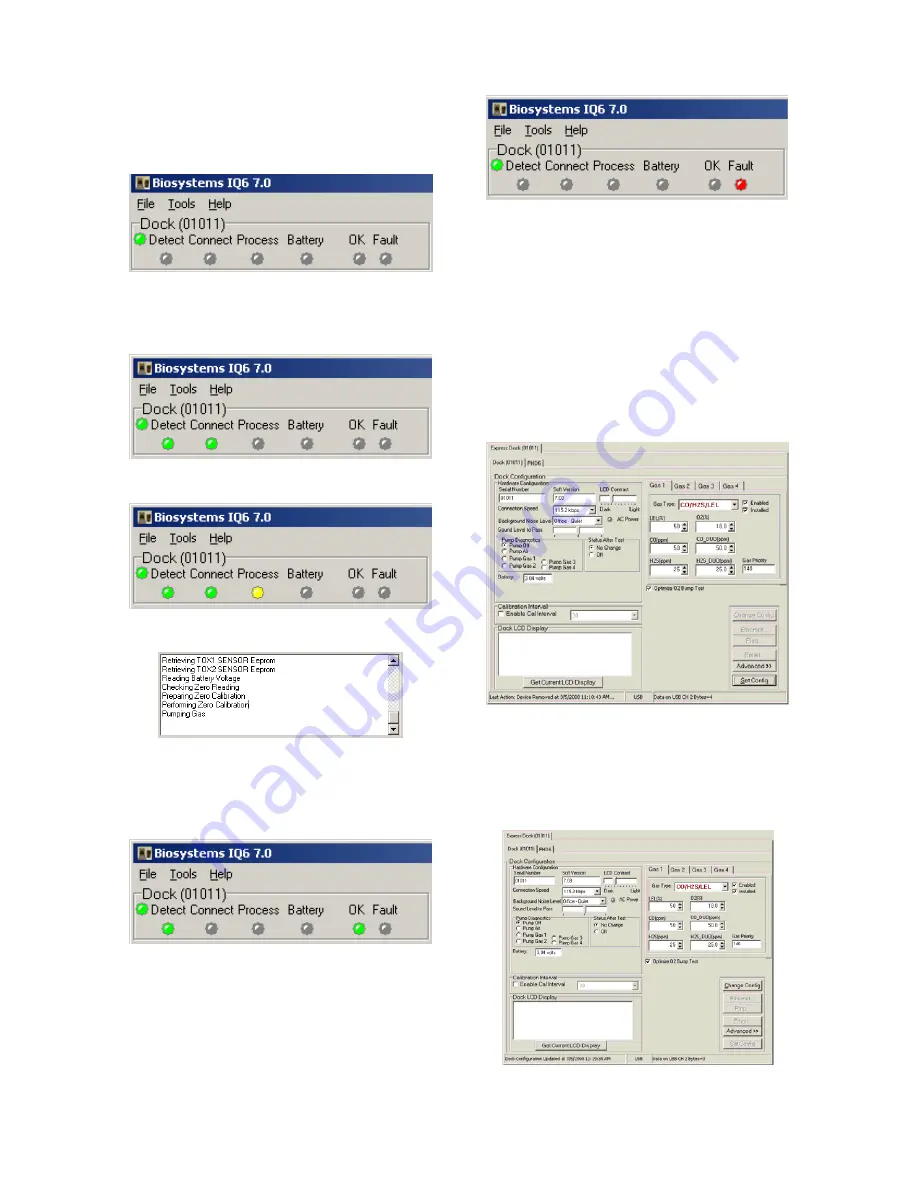
The current status of each dock is shown
in the left column. When there are no
detectors in the dock, each of the status
indicators will be shown in grey.
When a detector is placed in the dock,
the indicator will change to reflect the
new status. Status changes are also be
shown on the dock’s LCD.
During processing, the Processing
Indicator is shown in yellow.
The operations being performed on the
instrument are listed as they occur.
If the dock is able to successfully
complete the processing dictated by the
instrument’s template in the IQ Database
Manager Pro Program, OK will be shown
in green.
For more information regarding
template settings, see the IQ Database
Manager Pro Reference Manual.
If a fault is detected and the dock is
unable to complete the tests, the red fault
light will be shown on the screen. Details
of the fault will be listed in the input box
on the right side of the screen under the
instrument tab. See section 3.2.2 for
details on faults.
3.2 Dock Controls and Instrument
Status
The right side of the screen contains
individual controls for each IQ6 Dock.
Each dock has its own page, which can
be accessed by clicking on the
appropriate tab at the top of the page.
Within each dock’s page are two sub-
tabs. One contains specific information
on the dock itself. The other displays
information on the instrument that is
currently recognized in the dock.
Note: If the “Change Config” button
is enabled, press it before making any
changes to the settings.
3.2.1 Dock Configuration
Click on the Dock tab to access the dock
settings.
To change the configuration of the IQ6
Dock that is displayed, click on the
“Change Config” button at the lower right


