background image


74 

Chapter 2 MultiLab Software 

Square root 

C

BG

A

y

+

=

1


Draws a line of the square root values of a data set: The argument 

1

2

G

C

 must be greater than or equal to zero. 


Subtract 

2

1

BG

AG

y

=


Draws a line the subtraction of two data sets. 


Tan 

)

tan(

1

C

BG

A

y

+

=


Draws a line of the tangent values of a data set. The argument 

C

BG

+

1

 must be expressed in radians. 

2.6.9. Online 

Analysis 

MultiLab enables you to analyze data from a live experiment and to display the 
analysis function in the graph window, as the data is being recorded and processed. 
To execute online analysis, you will first have to use the Analysis Wizard to define 
the function to be used, and then edit the graph in order to display the function (see 
page 46). 
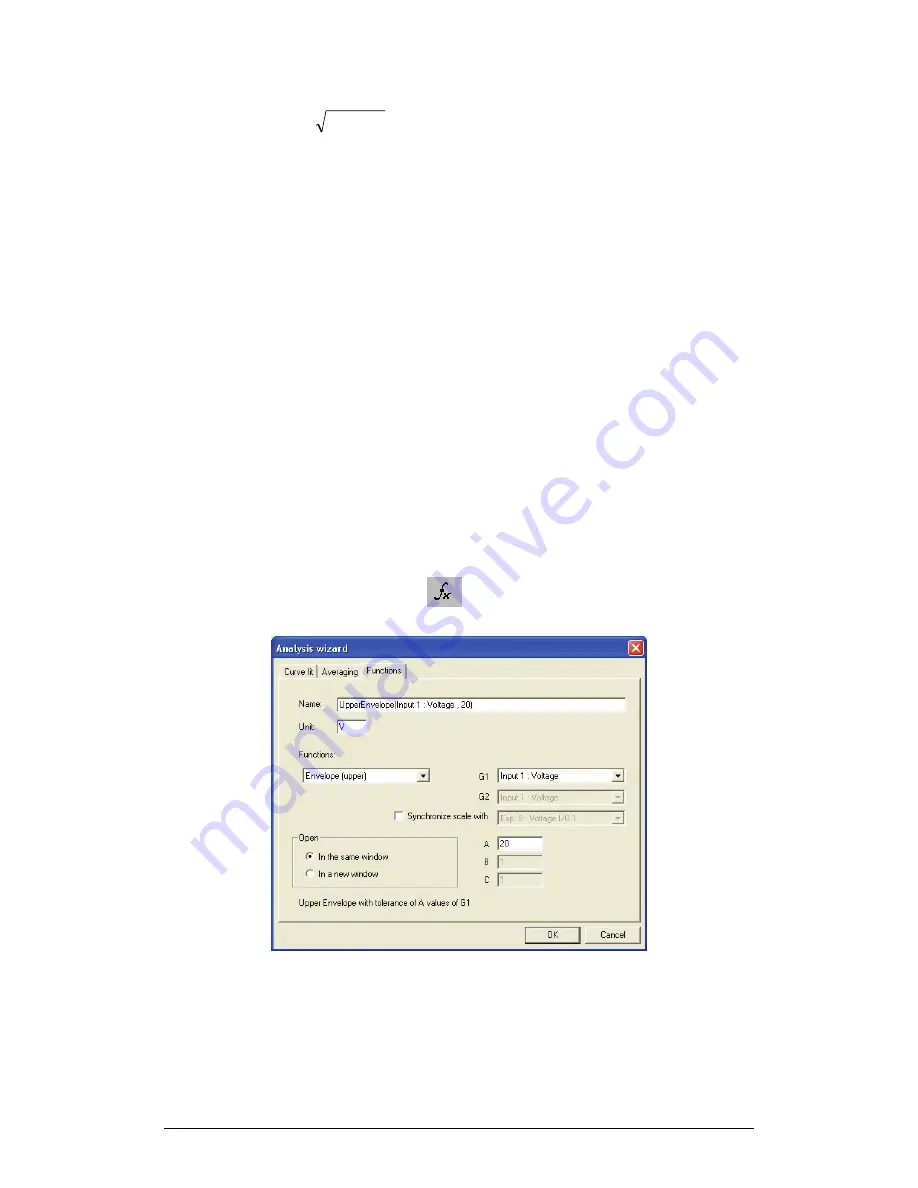
For example, here is how to set up an online envelope (amplitude) function of data, 
recorded with a Voltage sensor connected to Input 1: 

1.  Click 

Analysis Wizard


 on the main toolbar to open the 

Analysis Wizard dialog box: 


Figure 22: Analysis Wizard – online functions 

2.  Select 

Envelope (upper

) from the 

Functions

 list. 

3.  Select 

Input 1: Voltage

 from the 

G1

 drop list. 

4.  Click 

OK

Содержание MultiLab

Страница 1: ...orld of scientific data at the fingertips of your students The perfect combination between a graphic calculator and a data logger New Improved 12b resolution timing module New Improved 12b resolution...

Страница 2: ...MultiLogPRO User Guide Fourier Systems Eleventh Edition First Print Printed in July 2006...

Страница 3: ......

Страница 4: ...Timing Events 13 1 Stopwatch 14 2 Time and Speed 15 3 Time Speed and Acceleration 16 1 2 7 Select Sensors Manually 17 1 2 8 Load the Last Setup 18 1 2 9 Configure Your MultiLogPRO 18 1 Input Mode 18 2...

Страница 5: ...ogPRO 32 4 Start Recording 32 2 3 2 Data Recording Options 32 1 Single Measurement 32 2 Replace 32 3 Add 32 2 3 3 Manual Sampling 32 2 3 4 Online Video 33 1 Online Video 33 2 Recording 33 3 Replaying...

Страница 6: ...Sensor 56 4 Presetting the Display 57 5 Presetting the Graph s X axis 58 6 Triggering 58 2 5 2 Start Recording 60 2 5 3 Stop Recording 60 2 5 4 Clear MultiLogPRO s Memory 60 2 5 5 Edit MultiLogPRO s...

Страница 7: ...ing with Workbook 87 2 8 2 Opening a Worksheet 87 2 8 3 Create Your Own Worksheet 88 1 Create an HTML Document with Word 88 2 Create a Configuration File 88 2 9 Special Tools 90 2 9 1 Predicting 90 2...

Страница 8: ...atistics 117 5 Integral 118 3 6 Data Collection Modes 119 1 Log Data 120 2 Time Graph 120 3 Events with Entry 120 4 Single Point 120 5 Selected Event 121 3 7 Conditioned Data Collection 121 1 To Enabl...

Страница 9: ......

Страница 10: ...ith the PC MultiLogPRO includes a built in easy to use accurate Timer module that enables the measuring of several types of timing events The MultiLogPRO system combines with the powerful MultiLab sof...

Страница 11: ...y using the MultiLab software to program the data logger when working online working with the video tool and communicating with the Nova5000 Chapter 3 guides you in how to operate the MultiLogPRO and...

Страница 12: ...ypad How to set up MultiLogPRO How to connect MultiLogPRO to your PC 1 1 General 1 1 1 MultiLogPRO System Contents Figure 1 Contents of the MultiLogPRO system 1 The MultiLogPRO data logger 2 Sensors s...

Страница 13: ...nect them to inputs 1 and 2 and so on In order to connect more than 4 sensors at a time use the splitter cables which will enable the connection of up to 8 sensors simultaneously When a splitter cable...

Страница 14: ...B plug to the MultiLogPRO and the USB Type A plug to the PC see page 26 for USB driver installation 3 External DC power supply socket Plug in an AC DC 9 12V adaptor whenever you want to save battery...

Страница 15: ...er way is to use the MultiLab software see Chapter 2 The keypad allows us to set all the parameters for data collection while the LCD screen displays the setting values 1 2 1 Front Panel Layout fn Fig...

Страница 16: ...O 4 and I O 5 I O 3 splits into I O 3 and I O 6 I O 2 splits into I O 2 and I O 7 I O 1 splits into I O 1 and I O 8 In the splitter cable one of the two wires is marked with arrows that is the main i...

Страница 17: ...must be connected to I O 1 If two sensors are used in an experiment they must be connected to I O 1 and I O 2 The arrow indicates that MultiLogPRO is ready to accept a new sampling rate If the MultiLo...

Страница 18: ...PLES 200 DISPLAY numeric 5 Choose Display Use the Forward and Backward arrow buttons to select the type of display and then press the Enter button In 1 Microphone In 2 Light In 3 In 4 SAMPLES 200 DISP...

Страница 19: ...turned on MultiLogPRO opens with a system information window and then displays the main menu MultiLogPRO has 9 menus Use the Forward or Backward Arrow buttons to highlight a menu and press the Enter...

Страница 20: ...Displays the sensor values and the sample number Meter Displays all active sensors in a bar meter display along with their values Table Displays the last 6 values of all the active sensors in a table...

Страница 21: ...nt date and time whenever the logger communicates with MultiLab Timing Enter to the timing module You can select between the following timing events Stopwatch Time and speed in one photogate Time and...

Страница 22: ...es at the bottom of the graph 3 If there is more then one sensor press the Enter button to move the cursor to another plot on the graph 2 Zooming 1 Position the cursor in the area you want to zoom int...

Страница 23: ...u r e I n 1 C a r d w i d t h 3 0 m m G a t e s d i s t a n c e 2 0 c m S t a r t The arrow indicates that MultiLogPRO is ready to accept the timing mode 4 Use the arrow buttons to select the desired...

Страница 24: ...In2 if you want to measure time and speed between two gates Time and speed at one gate Time and speed between gates MultiLogPRO measures the time between blocking and unblocking the photogate at input...

Страница 25: ...ime it takes the body to move from one gate to the second gate and the crossing time at the second gate and returns the time between gates the average speed and the average acceleration _ _ _ _ _ T I...

Страница 26: ...button The arrow indicator will move to the second input 4 Repeat this procedure with all the sensors you plugged in 5 After the fourth sensor has been selected the screen will list the next 4 sensor...

Страница 27: ...e MAIN MENU screen select the System configuration icon to display the configuration screen The default configuration is Input Mode Auto ID Clear memory DO2 calibration Contrast Comm PC Use the Forwar...

Страница 28: ...and press the Enter button to confirm MultiLogPRO will display the calculated upper limit of the calibrated range and will exit the DO2 calibration screen The new calibration parameters will be saved...

Страница 29: ...ose the Right Setup 1 Sampling rate The sampling rate should be determined by the frequency of the phenomenon being sampled If the phenomenon is periodic sample at a rate of at least twice the expecte...

Страница 30: ...connected to the PC and the MultiLab software is running the data is automatically saved to the computer and displayed in a real time graph To operate in Continuous mode select RATE equal to or less...

Страница 31: ...per second 2 3 701 samples per second 3 2 631 samples per second 4 2 041 samples per second 5 1 667 samples per second 6 1 409 samples per second 7 1 220 samples per second 8 1 076 samples per second...

Страница 32: ...ntil the sensor shows the correct measured value obtain the actual correct value from another source that is known to be accurate 1 3 2 MultiLogPRO Automatic Zero Calibration MultiLogPRO is able to au...

Страница 33: ...and from the Configuration menu see page 19 1 3 5 MultiLab Sensor Calibration The sensors can also be calibrated using the Calibrate Sensors option in MultiLab s Logger menu Please refer to section 2...

Страница 34: ...0 MB to install the supporting applications Free serial or USB port To work with the video window your system should be equipped with a video camera a free USB port and a compatible camera driver inst...

Страница 35: ...will be prompted to restart the computer Select Yes To install MultiLab 1 Close all programs 2 Insert the CD labeled MultiLab into your CD ROM drive 3 The installation process will begin automatically...

Страница 36: ...l automatically detect and install the necessary software To install the USB driver You will need to install a USB driver in order for the MultiLogPRO to communicate with your PC via a USB port On Win...

Страница 37: ...ll need to install the Nova5000 drivers from the Nova5000 software CD or from the MultiLab v1 4 11 Installation CD On Windows XP 1 Connect the Nova5000 to a USB port on your PC and turn the unit on Wi...

Страница 38: ...or any combination of the four The most commonly used tools and commands are displayed on three toolbars Tools that relate to all aspects of the program and tools that control the MultiLogPRO are loca...

Страница 39: ...d process for a given experiment is stored in a single project file Each of these files contain all the data sets you collect with the MultiLogPRO the analysis functions you ve processed the video fil...

Страница 40: ...time Windows will automatically detect the new device and open the Found New Hardware Wizard Follow the on screen instructions When asked select the Install software automatically option there is no...

Страница 41: ...Measurement MultiLab will open a new project file every time you start a new recording session 2 Replace MultiLab will display the new data set in place of the old one The project s old data sets will...

Страница 42: ...Video window Click Video on the main toolbar to display the video window and enable video see page 31 2 Recording 1 From the Video menu select Enable video 2 Click Record on the right hand side of th...

Страница 43: ...eriment Online communication When MultiLogPRO is connected to the PC and is programmed to run at sampling rates of up to 100 s MultiLogPRO transmits each data sample immediately as it is recorded to t...

Страница 44: ...to measure timing events with MultiLogPRO s Timer module see page 13 To use the photogates together with other sensors operate MultiLogPRO as a data logger and then analyze the photogates data with t...

Страница 45: ...ys the results in a bar graph and in the table You can repeat as many measurements as you want After each event MultiLab adds the results as a new bar in the graph and as a new raw in the table To exi...

Страница 46: ...ty You should enter the body s width in mm Between gates Measures the time it takes the body to move from one photogate to the second photogate between blocking the first and blocking the second infra...

Страница 47: ...Time Schemes and Calculations Time measurements At one gate Result 1 2 t t t Between gates Result 1 3 t t t Velocity At one gate Required parameters w The body s width Result 1 2 t t t t w v t1 t2 t2...

Страница 48: ...parameters L The distance between gates Result 1 3 t t t t L v Acceleration Between gates Required parameters w The body s width Result t v v a t t t t t t t w v t t w v 1 2 1 2 3 4 3 4 2 1 2 1 2 t1 t...

Страница 49: ...3 Double click the file name to open the project MultiLab opens the project and displays the first graph on the graph list If the project does not include saved graphs the file opens with an empty gr...

Страница 50: ...See for example the table below 3 On the File menu click Save As 4 In the File name box type a name for the workbook 5 In the Save as type list click the CSV format 6 Click Save To import files that...

Страница 51: ...tiLab Software 3 If you want to print only a specific range uncheck the Print all data check box and type the desired row numbers into the To and From edit boxes 4 Click Print to open the print dialog...

Страница 52: ...indow display type you want 4 Click OK In addition to these sections you have the option to display an on screen meter for each of the sensors see page 51 2 4 2 Graph Display Click Graph to display or...

Страница 53: ...play the difference between two coordinate values or to select a range of data points To display the first cursor Double click on an individual data point or click 1st Cursor on the graph toolbar You...

Страница 54: ...ee above 2 Click Zoom in on the graph toolbar 3 To reverse the operation click Zoom out on the graph toolbar To zoom in to a range 1 Select the range with both cursors 2 Click Zoom in on the graph too...

Страница 55: ...ck on the axis to restore auto scaling 4 Panning Use the pan tool after zooming in to see any part of the graph that is outside the zoomed area To do this click Pan on the graph toolbar then click any...

Страница 56: ...corresponding plot s color and will automatically change with any change made to the color of the corresponding plot 1 Click Graph properties on the graph toolbar to open the Graph properties dialog b...

Страница 57: ...en click OK To move an annotation 1 Click Move annotation on the graph toolbar 2 Click on the annotation you want to move then drag if to the new position 3 Click Move annotation a second time to exit...

Страница 58: ...e the table window When you start a new recording MultiLab displays the new data on the table To add or remove columns from the table use the Edit table tool see below 1 Editing Data Values You can ch...

Страница 59: ...Font tab 3 Format the font as well as the font style and size 4 Click OK Changing units and number format 1 Click Table properties on the table toolbar 2 Select the Units tab and then select the plot...

Страница 60: ...ta map is a separate window that displays the list of data sets that were recorded or downloaded in the current session as well as the lists of all the saved graphs and tables Use the Data Map to navi...

Страница 61: ...idual function Currently displayed on graph 1 Individual function Currently displayed on graph 2 Individual function Currently displayed both on graphs 1 and 2 Function Experiment Includes all recorde...

Страница 62: ...the data properly try to change the export file settings 1 Click File on the menu bar then click Export file settings 2 Check the Ignore regional settings check box 3 Click OK 2 4 7 Copy the Graph as...

Страница 63: ...tup wizard Figure 10 Setup wizard step 1 of 3 The first step is to assign sensors to each input If you are working with MultiLogPRO in Auto ID mode the sensors are selected automatically as you plug t...

Страница 64: ...ples Recording period Recording rate 8 To start the data recording only when a specific time or measurement condition has been met click Triggering to open the triggering dialog box see page 58 9 Clic...

Страница 65: ...properties click the corresponding tab at the top of the dialog box 5 Click OK 3 Setting the Zero Point of a Sensor MultiLab enables you to rescale some sensors and to set the current readings to zero...

Страница 66: ...s settings prior to beginning a recording session You can define the settings of each sensor input individually in the first step of the Setup Wizard 1 Click Setup Wizard on the main toolbar to open t...

Страница 67: ...rement you d like to display on the X axis 4 If you want a specific scale uncheck the Auto scale check box and enter the minimum and maximum values of the axis 5 Click OK 6 Triggering To start the dat...

Страница 68: ...g when the recorded data from the sensor falls above or below a certain level for example a fan that will start operating when the temperature measured by the sensor rises above 30 C This function req...

Страница 69: ...ry in the Logger menu 2 5 5 Edit MultiLogPRO s Experiment Notes 1 Connect MultiLogPRO to the PC 2 Select Edit notes from the Logger menu to open the Notes dialog box with the MultiLogPRO s current exp...

Страница 70: ...l not need to use this option but MultiLab enables the user to define additional custom sensors This is a useful tool for when MultiLogPRO is communicating with many sensors from different vendors Any...

Страница 71: ...ion The computer may have several communication ports One of these ports is usually available for external communication It is not necessary to know which port is available since MultiLab will find it...

Страница 72: ...the event of any communication malfunction please refer to 3 1 Troubleshooting Guide 3 You can click Work offline if you wish to work without MultiLogPRO While working offline you can still open save...

Страница 73: ...64 Chapter 2 MultiLab Software 4 Click Cancel if you wish to work without the data logger While working offline you can still open saved files to view and analyze them...

Страница 74: ...orking with the Analysis Tools The analysis tools can only be applied to data sets that are displayed in the graph window 1 Use the cursors see page 44 to select the graph and the data range to which...

Страница 75: ...range Area The area between the graph and the x axis in the range Samples The number of data points in the range Rate The recording rate To display statistics 1 Use the cursors to select the graph and...

Страница 76: ...ouped into three main categories curve fit regression averaging and mathematical and trigonometric functions To apply an analysis function to a data set 1 Use the cursors to select the graph or data r...

Страница 77: ...rrelation coefficient on the information bar 6 Click OK Note If you want the automatic curve fit equation to start at 0 t apply the crop tool before any type of curve fitting see page 90 3 Averaging F...

Страница 78: ...al plots on the graph the list includes a separate time series for each plot as the number of data point may vary from plot to plot 3 If the analysis function involves two data sets select the second...

Страница 79: ...icon in the Data Map to open a context menu 2 Click Edit function to open the Function dialog 3 Enter the new parameters 4 Click OK 2 6 8 Available Analysis Tools This section includes a brief descri...

Страница 80: ...es of a data set Add 2 1 BG AG y Draws a line of the addition of two data sets Arccosine arccos 1 BG A y Draws a line of the arccosine values of a data set in radians Arccosine is the angle whose cosi...

Страница 81: ...is able to ignore random noises Envelope upper Upper envelope of G1 with tolerance of A points Draws a line that connects the maximum values of a data set The tolerance defines the minimum distance i...

Страница 82: ...f the natural logarithm of a data set The argument 1 BG must be positive Log log 1 10 BG A y Draws a line of the logarithm of a data set to base 10 The argument 1 BG must be positive Multiply 2 1 BG A...

Страница 83: ...o display the analysis function in the graph window as the data is being recorded and processed To execute online analysis you will first have to use the Analysis Wizard to define the function to be u...

Страница 84: ...1 Voltage to select it and then click Online function Envelope upper to select it 7 If there are other highlighted data sets in the Y Axis list deselect them by clicking on them 8 Click OK 9 Click Ru...

Страница 85: ...aws a parabola Exponential C Ae y Bt Draws an exponential line Power C At y B Draws a line of the time raised to the power of a number from 5 to 5 Note If you want the curve fit equation to start at 0...

Страница 86: ...er limits of each sliding bar are located on the sliding bar s left and right ends respectively You can change the limit values by clicking a limit box and typing in your new value MultiLab will displ...

Страница 87: ...yzer Basics Open the Video Motion Analyzer module Click Video Analysis on the main toolbar Open a movie from MultiLab s movie library or capture a new movie Capture position and time Scaling Scale the...

Страница 88: ...our computer from A device attached to your computer An external source through a video capture board 1 From a Device Attached to your Computer From a device attached to your computer such as a Web ca...

Страница 89: ...ert the tape into the VCR Go to the point you want to capture and then stop the tape 2 Find the video out on the back of the VCR and connect one end of the appropriate cable Connect the other end of t...

Страница 90: ...Lab will display two markers on the points you clicked 4 You can drag the markers to change their position 5 Type in the body s actual dimension in the Actual dimension edit box in cm 6 Click OK You c...

Страница 91: ...degrees in the X axis direction edit box 6 Click OK Set X axis direction 1 Click Rotate origin on the Video Motion Analyzer toolbar to open the Coordinate system dialog 2 Click a point in the frame w...

Страница 92: ...ideo Motion Analyzer toolbar and observe the motion 2 Decide what will be the marking point the exact point on the moving object that you want to mark Tip Try to choose a clear and sharp point that is...

Страница 93: ...you finish marking the whole motion of the first body and then repeat the process with the second body Simultaneous marking 1 Click Video Analysis on the menu bar point to Two body motion then click...

Страница 94: ...er 2 To scroll through the frames you can either use the Next frame and Previous frame buttons on the Video Motion Analyzer toolbar or drag the cursor on the graph or use the left and right arrow keys...

Страница 95: ...ion x coordinates and Y position By default the two data sets are displayed in the graph as a function of the time but you can use the edit graph tool to display the track Y vs X In Video Motion Analy...

Страница 96: ...new project file with the same predefined setup You can use Fourier produced worksheets or create your own You can also modify Fourier s existing worksheets to meet your own specifications 2 8 2 Openi...

Страница 97: ...g sensors measurement etc 1 Create an HTML Document with Word Create a new Web page 1 Open Word 2 In the File menu click New 3 Do one of the following On the General tab click Web Page to open a blank...

Страница 98: ...k Enter experiment settings to open the Setup wizard 5 Use the Setup Wizard to preset MultiLab and MultiLogPRO just as with the normal setup process see page 54 6 When you ve finished entering the set...

Страница 99: ...Wizard 1 Overview The Timing Wizard enables you to easily measure and calculate many types of time events including velocity and acceleration with one or two photogates Connect one photogate to input...

Страница 100: ...o select measurement Time Velocity or Acceleration 4 Click Next to move to step 2 5 Click an option to select the measuring method 6 If required enter the body s width or the distance between the gate...

Страница 101: ...es the time it takes the body to cross the photogate between blocking and unblocking the infrared beam Between gates Measures the time it takes the body to move from one photogate to the second photog...

Страница 102: ...locities You should enter the bodies width the width of the two bodies must be identical Acceleration At one gate A card with two flags must be attached to the moving body see figure to the left The T...

Страница 103: ...MultiLab Software 4 Time Schemes and Calculations Time measurements At one gate Result 1 2 t t t Between gates Result 1 3 t t t Pendulum one gate Result 1 5 t t t t5 t3 t1 t2 t4 t2 t1 t1 t2 t3 t4 Inp...

Страница 104: ...meters w The body s width Result 1 2 t t t t w v Between gates Required parameters L The distance between gates Result 1 3 t t t t L v Collision two gates Required parameters w The bodies width must b...

Страница 105: ...sult 7 8 2 5 6 2 3 4 1 1 2 1 t t w v t t w u t t w v t t w u Acceleration At one gate Required parameters w The flags width Result t v v a t t t t t t t w v t t w v 1 2 1 2 3 4 3 4 2 1 2 1 2 t5 t7 Inp...

Страница 106: ...convenient to attach a vertical flag to the cart see picture below You can mount a slotted wooden block on the cart and insert the flag onto the slot or use masking tape to attach the flag to one sid...

Страница 107: ...ply the crop tool before any type of curve fitting After applying the crop tool the trimmed data set replaces the original set on the graph display and a new icon is added to the Data Map under croppe...

Страница 108: ...ox Figure 28 Capture dialog box 2 In the Available Sensors list select the sensors you want to capture by clicking their name and then click Add 3 If you want to insert a manual column into the table...

Страница 109: ...tiLab enters the momentary data to the capture table sequentially 3 If logging stops simply click Run to continue the data recording and capturing 4 After you ve finished capturing the desired data cl...

Страница 110: ...1 2 Choose the data set that you wish to display on the X axis from the X Axis list by clicking its name 3 Choose the data set or sets you wish to display on the Y axis from the Y Axis list by clickin...

Страница 111: ...en connected to the PC 2 Install MultiLab from your Nova5000 software CD included with your Nova5000 packaging 3 On the Nova5000 open the Control Panel and open the Logger Options icon 4 The Logger Op...

Страница 112: ...Wizard to configure the sensor setup and then run the Nova5000 to start recording data 11 In the Setup Wizard to setup the sensors manually you must go to the Logger menu and unselect the Auto ID opt...

Страница 113: ...oad Download the data from the most recent recording session Setup Open the Setup dialog box Meter setup Open the Meter setup dialog box Data map Display the Data Map Graph Display the graph window Ta...

Страница 114: ...st recent zoom operation Autoscale Display all the data Zoom to selection Zoom in to a selected area Pan Pan in all directions while in zoom mode More smoothing Smooth average the selected curve Less...

Страница 115: ...its Add to project Add the current table to the project Capture Capture the momentary data 2 11 4 Video Motion Analyzer Toolbar Open Open movie Capture Capture new movie Set origin Set the origin of r...

Страница 116: ...Chapter 2 MultiLab Software 107 2 11 5 Capture New Movie Toolbar Record Start video capture Stop Stop video capture Analyze movie Return to Video Motion Analyzer mode...

Страница 117: ...108 Chapter 2 MultiLab Software...

Страница 118: ...into the CD drive if Installation begins automatically click Cancel 3 Run the TI connect program on your computer 4 Follow Sending application to a TI 83 Plus instructions 5 When you are asked to sele...

Страница 119: ...a few seconds MultiLab displays the main menu Figure 32 MultiLab for TI main menu 3 Setup MultiLogPRO 1 In the main menu screen press to open the setup screen MultiLab displays a list of the connected...

Страница 120: ...lowed time interval 7 Enter the total number of sampling point maximum of 1000 samples unless otherwise indicated on the screen 8 Press to return to the setup screen 9 Press to accept the setup and re...

Страница 121: ...ls menu 3 Enter the number of the experiment you wish to download 4 MultiLab will retrieve the data and will display the SELECT GRAPH screen 5 Use the Up and Down keys to select the graph you wish to...

Страница 122: ...Down keys to select the graph you wish to display then press Note Data outside the zoom region will be trimmed and lost To gain the data back download it from MultiLogPRO 3 Rescaling 1 From the graph...

Страница 123: ...hen press 4 Enter the scale unit then press 5 Use the Up and Down keys to select the graph you wish to display then press 6 Y Axis Scaling 1 Press 2 Enter the minimum value then press 3 Enter the maxi...

Страница 124: ...2 VS IO 1 If you select this option MultiLab will display the data from input 2 vs the data from input 1 2 For more options press 3 Use the Up and Down keys to select the desired option 4 Press 3 5 A...

Страница 125: ...Down keys to select the desired option 4 Press 2 Curve Fit 1 Press from the Select Analysis screen 2 Use the Up and Down keys to select the data for the X axis then press 3 Use the Up and Down keys t...

Страница 126: ...en press 5 Use the Up and Down keys to select a coefficient then press 6 Enter a new value for that coefficient then press MultiLab calculates the new fit equation and displays it together with the an...

Страница 127: ...cursor to the desired point 6 Press MultiLab displays the statistics results screen 7 Press to return to the main menu 5 Integral This option allows you to calculate the area of a selected range on th...

Страница 128: ...capture specific data points from MultiLogPRO stream of data like taking snapshots of the dynamic process After each capture MultiLab prompts you to enter a corresponding X value When capturing ends...

Страница 129: ...1 From the SELECT MODE menu select EVENTS WITH ENTRY then press 2 Press to return to the main menu 3 Press to start recording MultiLab displays the sensors values and the number of captured samples u...

Страница 130: ...the number of captured samples up to now 4 Press anytime you want to capture a sample 5 After you finish capturing the data press 6 Use the Up and Down keys to select a sensor then press to display a...

Страница 131: ...ition is has been met 2 To Disable the Triggering Condition 1 Navigate to the timing setup screen see above 2 Use the Up and Down keys to select none then press 3 8 Calibrating the Sensors Every senso...

Страница 132: ...when measuring the two actual values 5 Enter the 1st actual value then press 6 Enter the 1st read value then press 7 Repeat the last two steps for the other value MultiLab will calculate the new slope...

Страница 133: ...124 Chapter 3 Working with a TI Calculator...

Страница 134: ...nstalled I downloaded unexpected data There may be up to 100 experiments stored in the MultiLogPRO Performing a Download means loading one of them in sequential order You have probably loaded an old e...

Страница 135: ...nt sensor to the ground terminal Avoid working near strong electromagnetic fields e g engines fluorescent lights I turned the calibration screw but did not obtain the accurate calibration The calibrat...

Страница 136: ...e c Follow the on screen instructions to install WME You will now be able to run MultiLab If you have WME 9 installed on a non compatible version of MultiLab you can always uninstall WME 9 and install...

Страница 137: ...128 Chapter 5 Specifications...

Страница 138: ...Control Outputs Sampling Capacity Up to 100 000 Samples Analog sampling rate From 1 Sample hour to 20 800 Samples Sec Digital sampling rate 200 kHz Resolution 12 bit 4096 Levels Timer Module Time velo...

Страница 139: ...ng samples data for up to 10 years Automatic data recovery if there is a power failure Built in clock calendar that keeps track of time and date for each data recording Built in battery charger for ch...

Страница 140: ...m DT189 ECG 0 5V DT120 Force 10N 50N DT116 Geiger Muller Counter 0 1024 bq DT155 Heart Rate 0 200 bps DT014 Humidity 0 100 DT041 Humidity high accuracy 0 100 DT010 Light 0 130 klx DT009 Light 0 6 6 lx...

Страница 141: ...s Part Number Name Range Physics Biology Chemistry DT025 1 Temperature 200 1000 o C DT188 Temperature linear 10 110 o C DT068 Temperature DHG 10 110 o C DT004 Voltage 50mV DT003 Voltage 0 5V DT002 Vol...

Страница 142: ...o a serial port on the PC USB Communication Cable D180 Connects MultiLogPRO to a USB port on the PC Weather Box DT177 Sealed box meets IP 65 standards Used to store the MultiLogPRO while operating in...

Страница 143: ...tatistics o Smoothing averaging o Manual curve fitting o Mathematical and trigonometric functions o Timing wizard for easy analysis of timing events including velocity acceleration pendulum period and...

Страница 144: ...c and manual data download Programs the data logger instead of using the data logger keypad Triggering Data Analysis o Automatic curve fitting linear quadratic power and exponential o Integral o stati...

Страница 145: ...136 Chapter 5 Specifications...

Страница 146: ...t notes dialog box 60 Figure 16 Define new sensor dialog box 62 Figure 17 Communication setup dialog box Windows 63 Figure 18 Communication setup dialog box Mac OS 63 Figure 19 Analysis wizard curve f...

Страница 147: ...guration Mini DIN female MultiLogPRO panel view When you define a custom sensor in the MultiLab program you must choose one sensor from the list provided Note its position in the list and look in Tabl...

Страница 148: ...display control the display 51 data map 51 graph 43 meters 51 options 43 properties 57 select 9 table 49 video 33 Do2 19 download 34 112 E edit data values 49 graph 46 notes 60 table 49 enter 8 11 es...

Страница 149: ...om 61 measurement 55 plug in 8 properties 55 setup 8 11 17 18 20 54 110 slope See derivative smoothing 65 snapshot 98 socket configuration 138 spreadsheet 53 stand alone 6 start 9 11 32 statistics 117...

Отзывы: