Chapter 2 MultiLab Software
43
2.4.
Viewing the Data
2.4.1. Display
Options
The MultiLab program screen consists of four parts: Graph window, table window,
video window and Data Map window. You can display all four parts simultaneously
(the default view) or any combination of the four.
The graph window is the main window by default and is and displayed in the center
of the application window. To specify other window as the main window:
1. Click
View
on the menu bar, then click
View selection
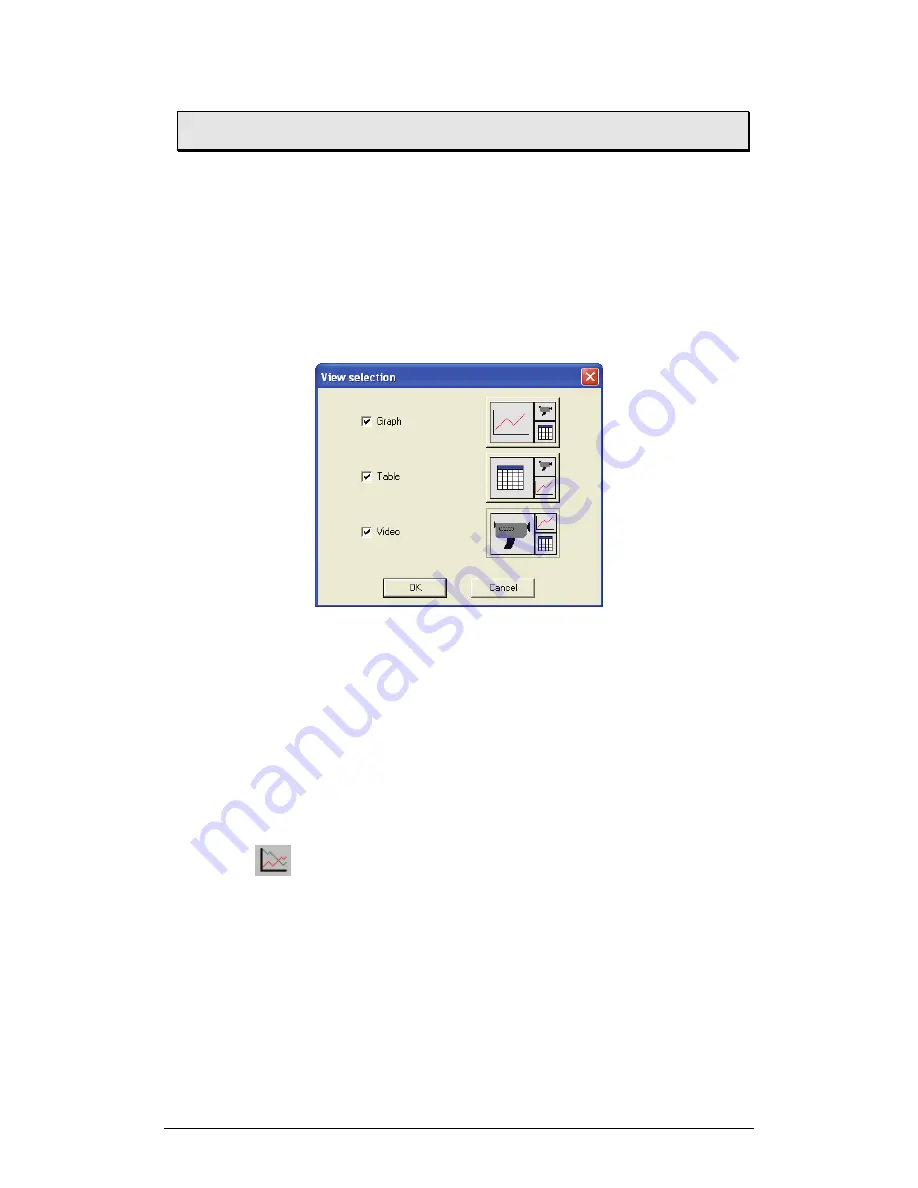
to open the
View selection dialog box:
Figure 7: View selection dialog box
2. Check the checkbox next to any window you’d like to include in the
view.
3. Click the window display type you want.
4. Click
OK
.
In addition to these sections, you have the option to display an on-screen meter for
each of the sensors (see page 51).
2.4.2. Graph
Display
Click
Graph
to display or hide the graph. The default graph display is the data
set or sets plotted vs. time, but you can change the X-axis to represent any of the
individual data sets (see page 46).
The graph usually displays all the data sets of a given recording, but you can use the
Data Map to remove one or more of the sets from the graph (see page 51).
In order to keep the graph clear and simple, only two Y-axes are shown on the graph
at once. If there are three curves in the graph, one of the Y-axes is hidden. To make
this axis visible, select the corresponding plot with the cursor (see section 2 below).
You can identify the Y-axis by its color, which matches the plot color.
Содержание MultiLab
Страница 2: ...MultiLogPRO User Guide Fourier Systems Eleventh Edition First Print Printed in July 2006...
Страница 3: ......
Страница 9: ......
Страница 117: ...108 Chapter 2 MultiLab Software...
Страница 133: ...124 Chapter 3 Working with a TI Calculator...
Страница 137: ...128 Chapter 5 Specifications...
Страница 145: ...136 Chapter 5 Specifications...


