


3: Detailed User Interface Features
26
Toggle 2D/3D
– Selection of this button will switch the thickness graph between a 2D view and
a 3D view. In the 3D view, every measured point is shown (
position 5 – 55mm, slice # 0 – 24
). In
the 2D view, the 3D slice data is averaged.
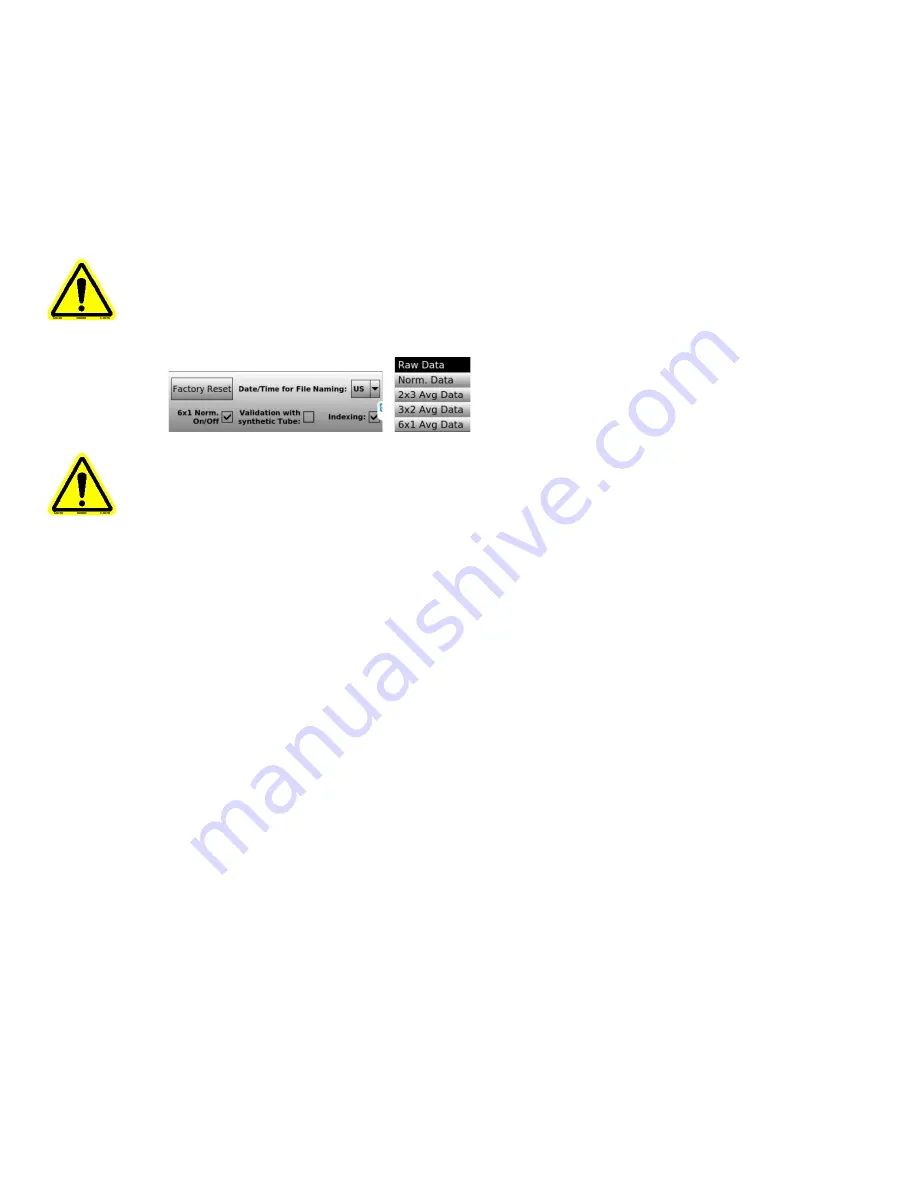
Raw Data
– Selection of this button enables a drop down, presenting the operator with five
graph display options for viewing the test data.
Note: If the 6x1 checkbox is enabled from the Settings Screen, the ‘6x1 Avg Data’ option will
be shown in the drop down.
Note: The 2D view and the view of the normalized data are not available during an active
measurement test. They can only be viewed after completion of the measurement
test when the normalize value has been determined.
When a measurement file is loaded using the ‘File Browser’ display, (
double clicking on a selected
test file will also open the test file data in the measurement display
) it is shown in the
‘Measurement’ display. In this case, the Measurement Status, Actual Measuring Point (
with
corresponding thickness
), elapsed time and remaining time values are not applicable and these
fields will be empty.