HPS-C - TS operating instructions
Page 17 / 32
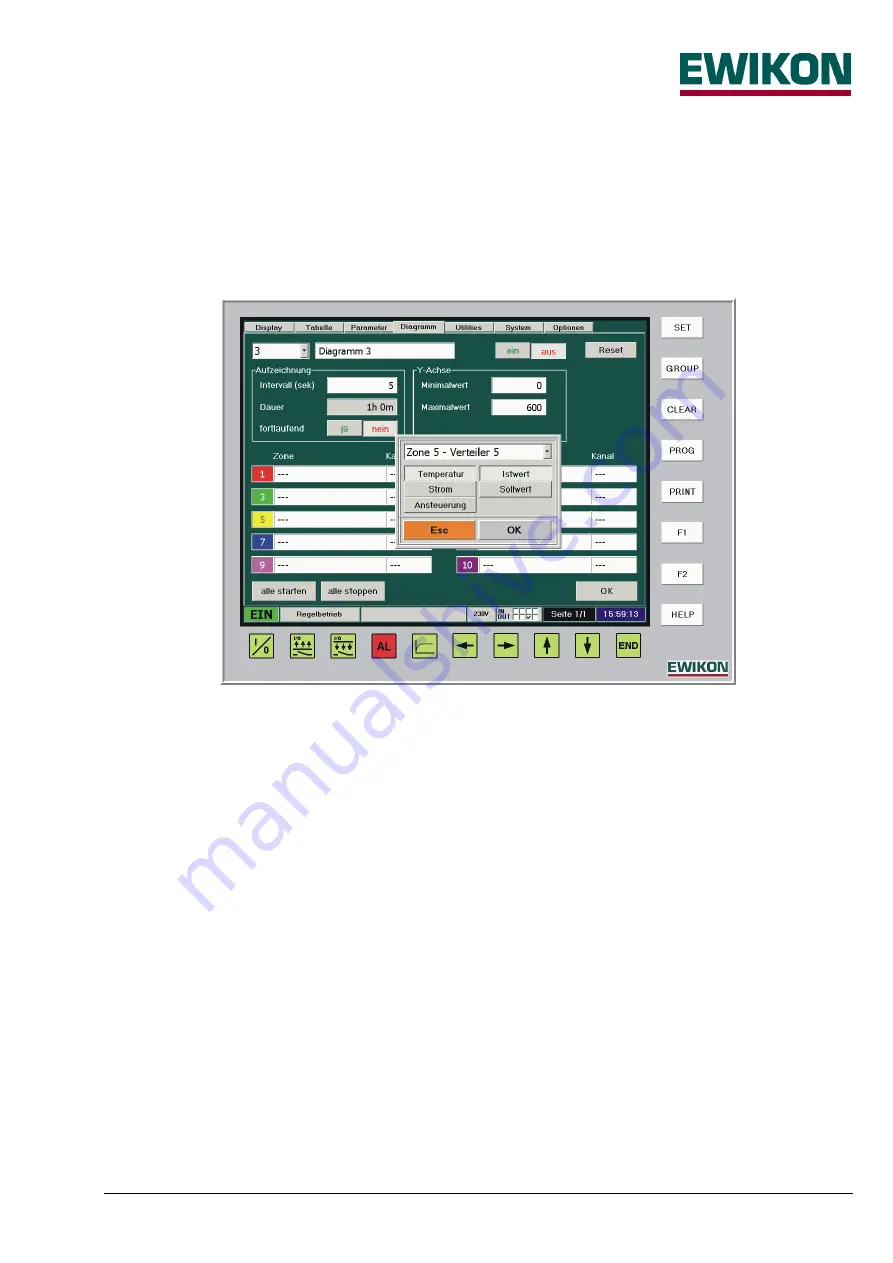
The settings for the time axis (X-axis) of the diagram are specified in the "recording" field. The interval specifies the cycle in
seconds over which the data is recorded. The whole recorded duration of the diagram changes depending on the interval
time, e.g. "Interval = 5 sec
Æ
duration = 1 h“, "interval = 10 sec
Æ
duration = 2 h". The interval time can be set between 1
second and 1 hour (3600 seconds); the total duration varies accordingly between 12 minutes and 30 days. The "continuous"
button is used to specify whether the data is to be recorded once ("no") or continuously ("yes"). In the case of continuous
recording the diagram is "shifted on" accordingly at the end and the x-axis is relabelled, the oldest data is lost. In the event of
once-off recording a certain period is recorded after the unit is switched on then the diagram function ends.
The minimum and maximum value of the y-axis scaling is specified in the "Y-axis" area, changes can also be made during
the current recording.
The required process values for the diagram are set in the lower area; a maximum of 10 different values are available for
each diagram. First the input window is opened by pressing the corresponding button, then the required zone or zone
number is either entered directly or selected by opening the sliding bar. Then the appropriate buttons are pressed to set the
required process value, to be recorded for this zone (e.g. "temperature - actual value" or "output power - set value“). The
settings are accepted with "OK" or discarded with "ESC".
After all the required zones to be recorded have been set for the diagram, data recording is switched on. After this only the
Y-axis scaling of the selected diagram can be changed, all other fields which can no longer be changed have a grey
background.
If necessary, other diagrams can be set up. The "Start all" and "Stop all" buttons can be used to switch recording on or off for
all the diagrams set up.
If the program is quit using the "END" key, the most recently recorded data of all active diagrams is backed up as a bitmap,
this bitmap is then available for viewing in the "Utilities" menu when the program is restarted.
To save memory space, this data is overwritten with the current values each time the program is quit.
Use the "Diagram" key or the "OK" button to return to the diagram view.


