


Page 81
EPS Stromversorgung GmbH
Alter Postweg 101 • 86159 Augsburg
Germany
Fon: +49 821 / 570451-0
Fax: +49 821 / 570451-25
www.eps-germany.de
PSI 10000 4U Serie
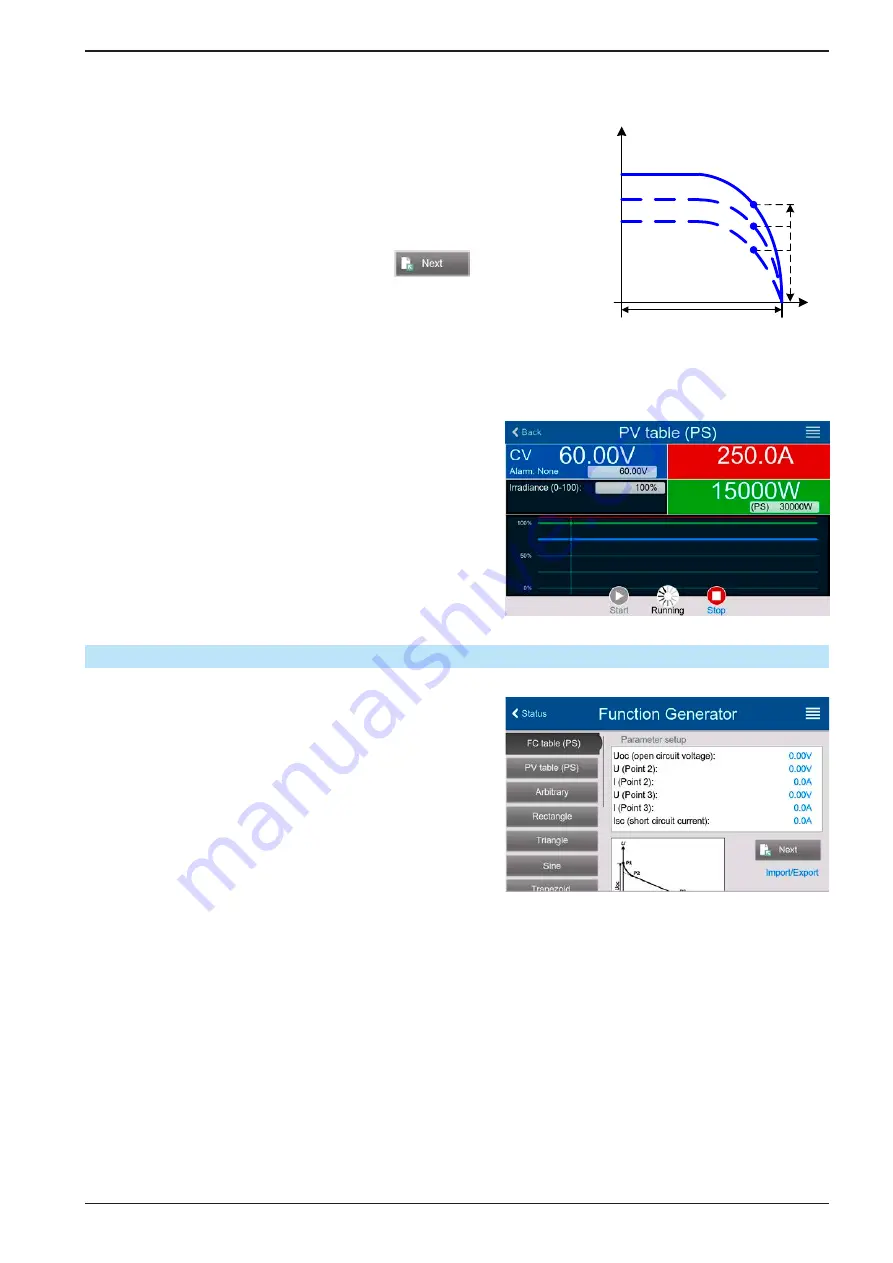
Varying this parameter shifts the MPP and the PV curve along the Y axis. Also see diagram to the right. The value
Irradiance
is here used as a factor for the current I
MPP
. The curve itself isn’t permanently re-calculated.
► How to configure the PV table
1.
In the function generator menu swipe up to find group
PV table
(PS)
and tap it.
2.
Adjust the four parameters as required for the simulation.
3.
Do not forget to adjust the global limits for voltage and power in the
next screen. The voltage (U) setting is automatically set as high as U
oc
and should not be lower, but can be higher.
4.
Proceed to the main function screen with
. Contrary to other
functions, the DC output is not automatically switched on, because then
the function would immediately. The function is only started when the
user switches the DC output on.
Irra
dianc
e 0
..10
0%
U
I
Uoc
MPP
From the main function generator screen, you can go back to the first screen of PV table function and use a for
-
merly locked
Import/Export
action button to save the calculated table to an USB stick. In order to do so, follow
the on-screen instructions. The table can be used to analyze/visualize the values in Excel or similar tools.
►
How to work with the PV table function
1.
With an appropriate load connected, for example a solar
inverter, start the function.
2.
Adjust value
Irradiance
with any rotary knob or per
touch input between 100% (default) and 0%, in order
to reproduce different light situations for the simulated
panel. The actual values on the display indicate the
working point and can show whether the simulation
has arrived at the MPP or not.
3.
Stop the function run anytime by the stop button or by
switching off the DC output.
3.10.14
FC table function (fuel cell)
3.10.14.1 Preface
The FC table function is used to simulate the characteristics
of voltage and current of a fuel cell. This is achieved by setting
up some parameters which define points on a typical fuel cell
curve, which is then calculated as XY table and passed to the
internal function generator.
The user has to adjust value for four support points. The
device will request to enter them step by step, indicating the
actual point on screen with small graphics. When finished,
these points will be used to calculate the curve.
Generally, following rules apply when setting up those values:
• U
OC
> U
Point2
> U
Point3
> U
Point4
• I
SC
> I
Point3
> I
Point2
> I
Point1
• Values of zero are not accepted
In order to express the rules in a simplified way: the voltage has to decrease from point 1 to point 4, while the
current has to increase. In case the rules are not followed, the device will reject the settings with an error and
reset them to 0.


