57
Graph
11.6
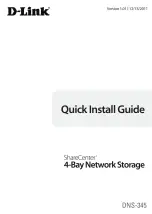
The Graph section of the monitor menu lets you build a graph of past sensor measurements, which gives you a
visual indication of data over time and points out trending values. To create your Graph, specify the Channel
( Sensors 1-32), Group Interval (1-120 minutes, hours, days, or weeks), the Group Function (Average, Min, Max),
and Start & End Times. Once you have entered all of the desired values, click "Build Graph."
Provision the Channels, Group Interval, Group Function and more - all from the
Graph Parameters section of the web browser interface.
Содержание D-PK-NG432
Страница 10: ...6 NetGuardian Front Panel 5 NetGuardian 432 G3 NetGuardian 432 G4 NetGuardian 480 G3 NetGuardian 480 G4 ...
Страница 50: ...46 Modbus Devices 10 12 The Provisioning Modbus Devices ...
Страница 52: ...48 Modbus Registers 10 13 The Provisioning Modbus Registers ...
Страница 75: ...71 ...
Страница 77: ...73 ...
Страница 78: ......