background image

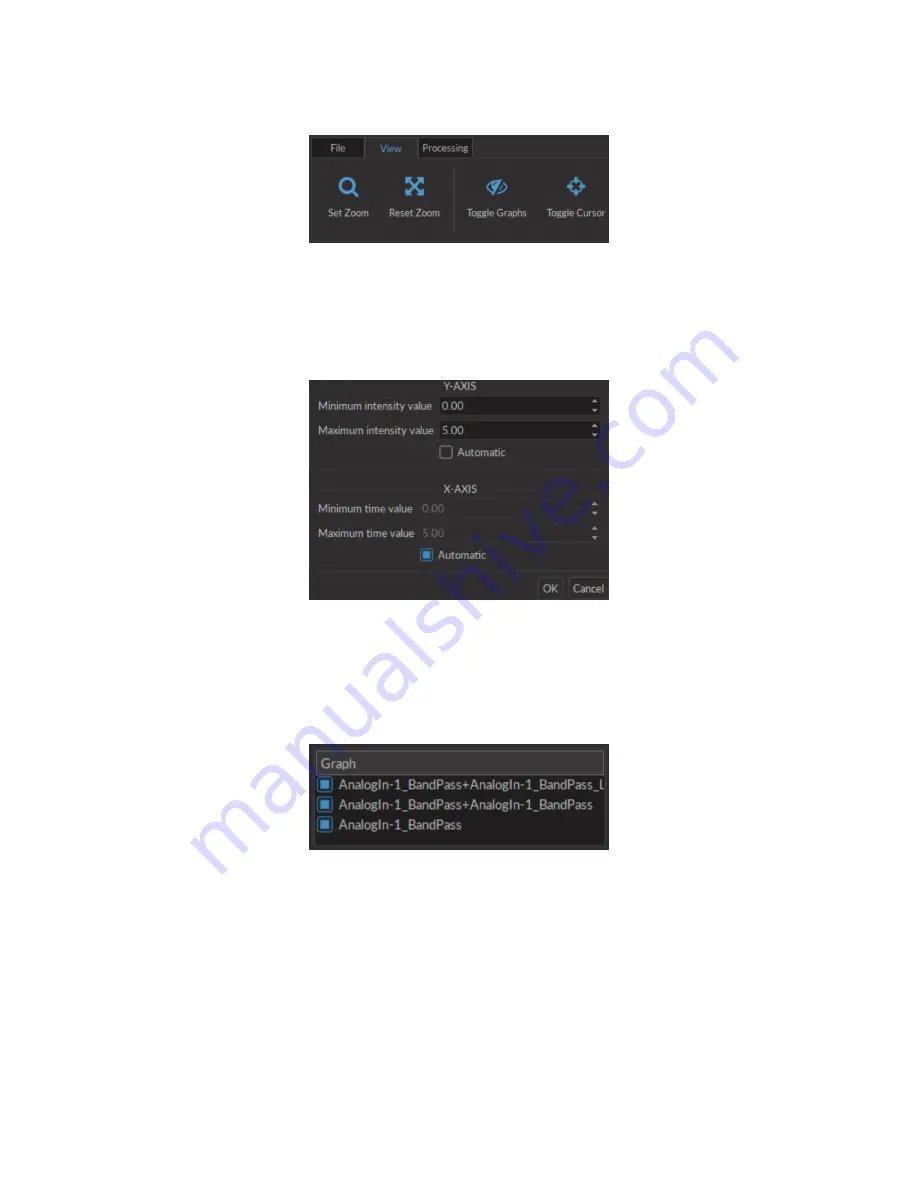
3.3.2 View

Figure 3.29:

View Tab

The

View

tab (Fig.

3.29

is used to adjust the view in the

Graphs box

.

• The

Set Zoom

button opens the

Zoom window

(Fig.

3.30

). The minimum and maximum values of each axis can be

defined. The

Automatic

checkbox chooses axis values to fully display the entire data set.

Figure 3.30:

Set Zoom Window

• The

Reset zoom

button resets the axis values to those defined in

Set zoom

.

• The

Toggle graphs

button opens the

Show/hide graphs

window (Fig.

3.31

). Any checked data sets will be dis-

played in the

Graph box

.

Figure 3.31:

Show/hide Graphs Window

• The

Toggle cursor

button, when clicked, activates a red cursor in the

Graphs box

. This cursor can be moved to any

part of a graph by clicking the location, showing the coordinates of the chosen point. The cursor will be positioned

at the same temporal location on each graph.

3.3.3 Processing

The

Processing

tab (Fig.

3.32

is used to process data sets loaded into the module.

Chapter 3. Doric Neuroscience Studio

33

Содержание Fiberless and Wireless Optogenetically Synchronized Electrophysiology System

Страница 1: ...Fiberless and Wireless Optogenetically Synchronized Electrophysiology System User Manual Version 2 1 0...

Страница 2: ...Guide 8 2 1 System Setup 8 3 Doric Neuroscience Studio 12 3 1 Fiberless and Wireless Optogenetically Synchronized Electrophysiology 12 3 2 Acquisition Console 17 3 3 Electrophysiology Analysis Module...

Страница 3: ...ure 1 1 Optogenetically Synchronized Electrophysiology System Layout The system uses a Fiberless Wireless Headstage to connect the Electrophysiology Console and the Fi Wi Opto electric Can nula using...

Страница 4: ...electrophysiological signal This is done using the Intan RHD 2132 chip Its secondary use is as an LED driver It sends pulse sequences to the stim ulation LED contained in the cannula The headstage als...

Страница 5: ...nsole Figure 1 4 Electrophysiology Console Front The Electrophysiology Console Fig 1 4 allows control of the different elements as well as reception and transmission of information from the control co...

Страница 6: ...ing Port its wireless connection is shut down The Status Lights on the side of the charger show the status of connected headstages The one closest to the connector is blue when the charger is ready fo...

Страница 7: ...ing elements The Stereotaxic Clamp is used to attach the holder to a rod in a stereotaxic apparatus TheHeadstageConnectorisusedtoholdaFi WiHeadstage Aheadstageinthispositionwillbeabletosend receive si...

Страница 8: ...n of interest of the animal s brain Fig 2 1 The process of implantation is not described in this document Figure 2 1 Implanted Fi Wi Opto electric Cannula 2 1 1 Electrophysiology Console Setup Figure...

Страница 9: ...ettings box Fig 2 4a 1 is used to define how electrophysiological data is acquired This includes triggering options as well as frequency filters The LED Options box Fig 2 4a 2 is used to define the ca...

Страница 10: ...headstage onto the USB Charger so the antenna is on the position indicator The console must be ON for the headstage to recharge which requires 60 min The headstage cannot connect wirelessly while bein...

Страница 11: ...bed in section 1 1 2 7 After use place the Fiberless and Wireless Headstage back onto the USB Charger to reset the wireless connec tion 8 To ensure optimal transmission The experimental subjects shoul...

Страница 12: ...ncorporates different functions to control our Doric Fiberless Wireless OSE system The core of the system is the Fiberless Wireless Headstage This device controls a Wireless cannula containing several...

Страница 13: ...ecting the channel icon will display the parameters of each respective Channel type 2 The Wireless settings Fig 3 2 are used to select recording and transmission settings a The Antenna selection Fig 3...

Страница 14: ...put one pulse every 2000 ms period iii The Time ON Duty Cycle Fig 3 2 sets the time in ms or the duty cycle in for each pulse The Time ON must be lower than 1 frequency 0 005 ms while the Duty cycle m...

Страница 15: ...ed on the window occupying a rectangular box Each Channel box shows a number of basic elements described in section 3 2 3 Elements uniquely associated with the Antenna channel are described here Figur...

Страница 16: ...shows the channel currently in use by the headstage When using two head stages the channel must be different for each headstage f The Pair button is used to pair an active headstage to a console When...

Страница 17: ...It enables control over the excitation light pulses or the sinusoidal waveform trig of an ex ternal source i e Doric LED driver with 4 TTL and 4 analog voltage outputs The module interface displays r...

Страница 18: ...type is currently being modified The channel can be changed by selecting a new one from the drop down list b The Mode identifies the type of signal sent for output channels or the way the signal is m...

Страница 19: ...ces Each numbered channel corresponds to the same number digital channel on the console Pulse se quences have different parameters depending on the Channel Mode which can be Continuous or Square for o...

Страница 20: ...can also be converted to a Duty Cycle which indicates the of the period the pulse duration corresponds to 3 The Pulse s per sequence set the number of pulses per sequence If it is set to 0 the number...

Страница 21: ...ol lowing elements appear in the Sequence Options box 1 The Starting Delay Fig 3 10 defines the time between the activation of the pulse sequence and the begin ning of the signal 2 The Time ON Fig 3 1...

Страница 22: ...conds period 2 The Time ON Fig 3 11 defines the length of a single pulse This time can also be converted to a Duty Cycle which indicates the of the period the pulse duration corresponds to 3 The Maxim...

Страница 23: ...tes a sinusoidal pulse sequence with peaks at V and V This includes all sequence options as the CW and Square mode save the following The Time ON option is changed for the Phase option Fig 3 12 This a...

Страница 24: ...ion of each Mode is described here The Linear channel mode Fig 3 13 allows the direct measurement of signal received by a channel The linear mode has the option of a frequency filter found in the Filt...

Страница 25: ...a Filter Tab b Response Tab Figure 3 14 Linear Mode Filter Options 7 The Response Tab displays the filter response attenuation according to frequency Chapter 3 Doric Neuroscience Studio 25...

Страница 26: ...hannels while periodically saving recorded data to the disk This mode is recommended for long measurement sequences Figure 3 16 Time Series Acquisition Timing Diagram 3 The Time Series button Fig 3 15...

Страница 27: ...nt indexation number used for multiple files saved during the same measurement session All this information is summarized in the Target File box The Decimation Settings allow the reduction of file siz...

Страница 28: ...ch current channel 4 The Load configuration button Fig 3 19 allows a console configuration in doric format to be loaded View Tab The View Tab Fig 3 20 is used to modify the presentation of graphs in t...

Страница 29: ...Mode Trigger Mode and Trigger Source if applicable Selecting the button while a window is open will close the window Figure 3 22 Legend Window 4 The Show Notes button Fig 3 20 will open the Note View...

Страница 30: ...ponding to that on the console This name can be modified in the Graph options window 2 The Edit button Fig 3 24 allows the editing of channel parameters opening the channel configuration windows For f...

Страница 31: ...than the default none may result in slower display and perfor mance degradation 4 The Graph Fig 3 24 box displays the graph of a channel with Voltage or State as the vertical axis and Time as the hor...

Страница 32: ...b allows the loading and saving of data Figure 3 28 File Tab The Load data button allows the loading of a csv file The file must contain time and signal data The Load notes allows the loading of a jso...

Страница 33: ...in Set zoom The Toggle graphs button opens the Show hide graphs window Fig 3 31 Any checked data sets will be dis played in the Graph box Figure 3 31 Show hide Graphs Window The Toggle cursor button w...

Страница 34: ...e data set to be filtered the filter window Fig 3 34 is opened This allows a choice of filter type and variables Figure 3 34 Filter Window The Filter specification allows the selection of a filter mod...

Страница 35: ...The Window before after threshold defines the time recorded in ms before after the point identified as a spike The Minimum time between events defines the minimum time in ms between two different spi...

Страница 36: ...ter plot of all spikes over time with each color corresponding to a single cluster This window can be kept active over multiple uses of the Spike finder with all raster plots displayed within Figure 3...

Страница 37: ...t spikes associated with each individual unit Figure 3 41 Unit box 5 The Timeline box shows the original graph with each spike identified Each color indicates a given unit as defined in the legend of...

Страница 38: ...r core diameter 200 or 400 m Table 4 2 Fiberless Wireless Headstage General Specifications SPECIFICATIONS VALUE NOTES Dimensions 9 6 x 14 9 x 18 6 mm Mass 2 8 g Including 40 mAh battery Transmission F...

Страница 39: ...00 Hz 26 1 V 18 5 bits 27 0 V bit 6 0 kSps C 6 041 Hz 166 s 3 100 Hz 46 0 V 17 7 bits 47 0 V bit 12 kSps C 12 166 Hz 82 s 6 300 Hz 120 V 16 3 bits 123 9 V bit Table 4 5 Console Recommended Environment...

Страница 40: ...urn instructions This warranty will not be applicable if the unit is damaged or needs to be repaired as a result of improper use or operation outside the conditions stated in this manual For more info...

Отзывы: