46
742.641 | 11.43
EN
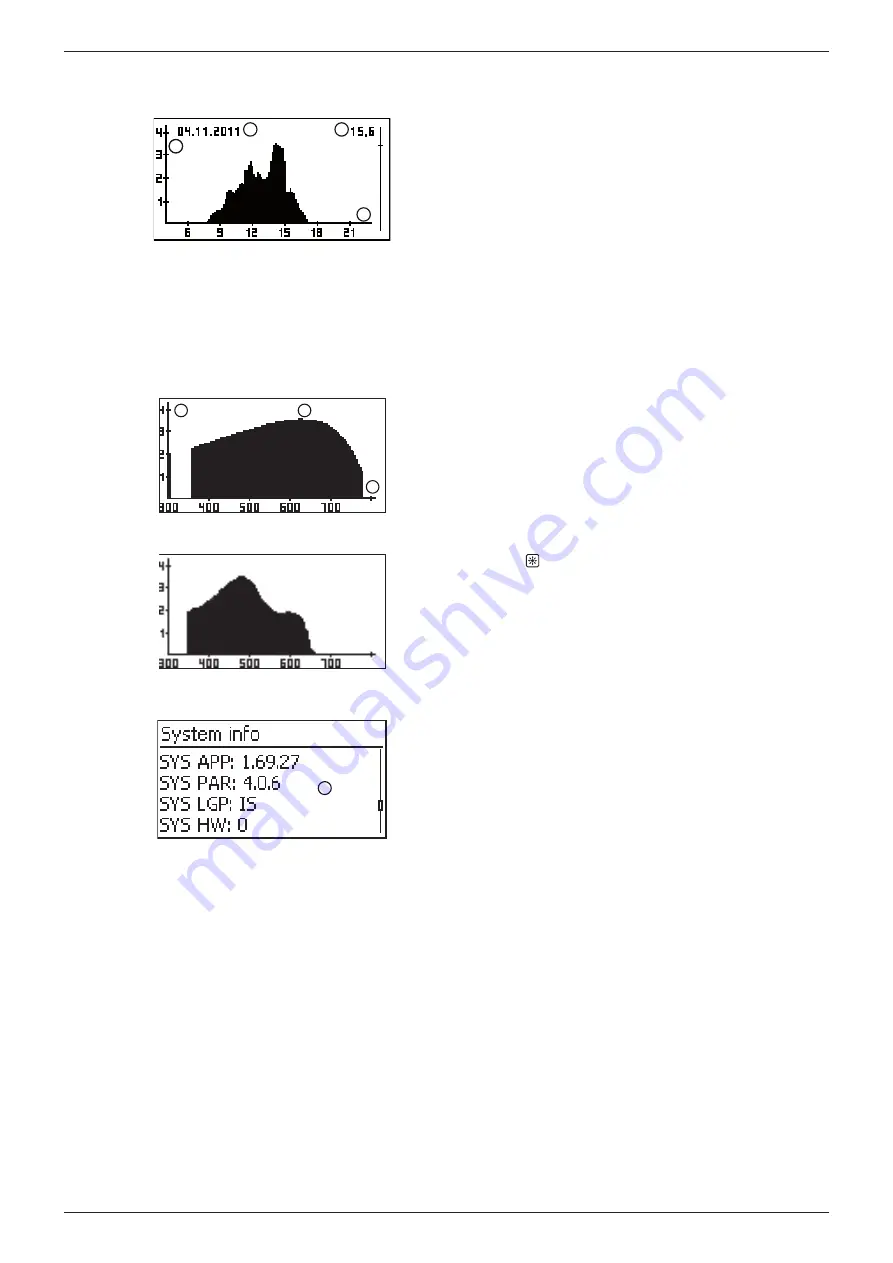
Graphical yield (day, month, year)
Daily, monthly and annual yields can be displayed graphically in a
Chart
.
22
3
1
4
Period for a single yield value (here: daily yield)
y-axis:
–
Yield in kWh
–
With an extra
M
: yield in MWh
–
The scaling changes depending on the maximum value
x-axis: time in hours/days/months/years
Total of all individual yields shown in the diagram, in kWh
The graphical representation can show annual yields for the
last 20 years.
Event messages
Generator characteristic curve
1
2
3
X-axis: Input voltage in V
Y-axis: Power in kW
Peak = MPP
When the
Gener. Ch. Curve
menu item is called the inverter
records the generator characteristic curve of the module and
then displays it (Fig. upper left). The following applies:
• The inverter traverses the entire input voltage range and
records the power generated over this range. Duration: a
few seconds, is displayed.
• The MPP is the peak of the generator characteristic curve.
• This peak and the generator characteristic curve change
with the level of solar irradiation.
• Multiple peaks are a sign of partial shadowing (Fig. lower
left).
System information
1
The
Information
menu item contains the following 4 sub-
menu items.
•
Contact
information
•
System
information
(see fig. left):
–
Product designation
–
Serial number of the inverter
–
Information on the software and hardware versions of
the inverter (see example
in fig. left)
–
Configured inverter address
–
Version of the operating instructions for the inverter
•
Country
parameters
: configured country and param-
•
Self
test
: result of the last successfully performed self
test (only when the configured country is
Italy
)
Содержание High Efficiency 3.0
Страница 111: ...109 742 641 11 43 Zertifikate Certificates Certificats ...
Страница 112: ...110 742 641 11 43 ...
Страница 113: ...111 742 641 11 43 ...
Страница 114: ...112 742 641 11 43 ...
Страница 115: ...113 742 641 11 43 ...
Страница 116: ......


