UhsasManualRevE060405DMT.doc,17 / 34
particle might be 3 V on G3 and 0.060 V on G2.) By noting many such events, a
relationship between the signal size of a particle on the two gain stages can be
determined---the relative gain. A linear fit to the data for many events produces a relative
gain and an offset between adjacent gain stages. By running this procedure on all
adjacent gain stage pairs (G3 and G2; G2 and G1; G1 and G0) a complete specification of
the relative gains can be developed, linking the optical and electronic signals across the
range of the instrument (which spans 6 decades of signal size in volts).
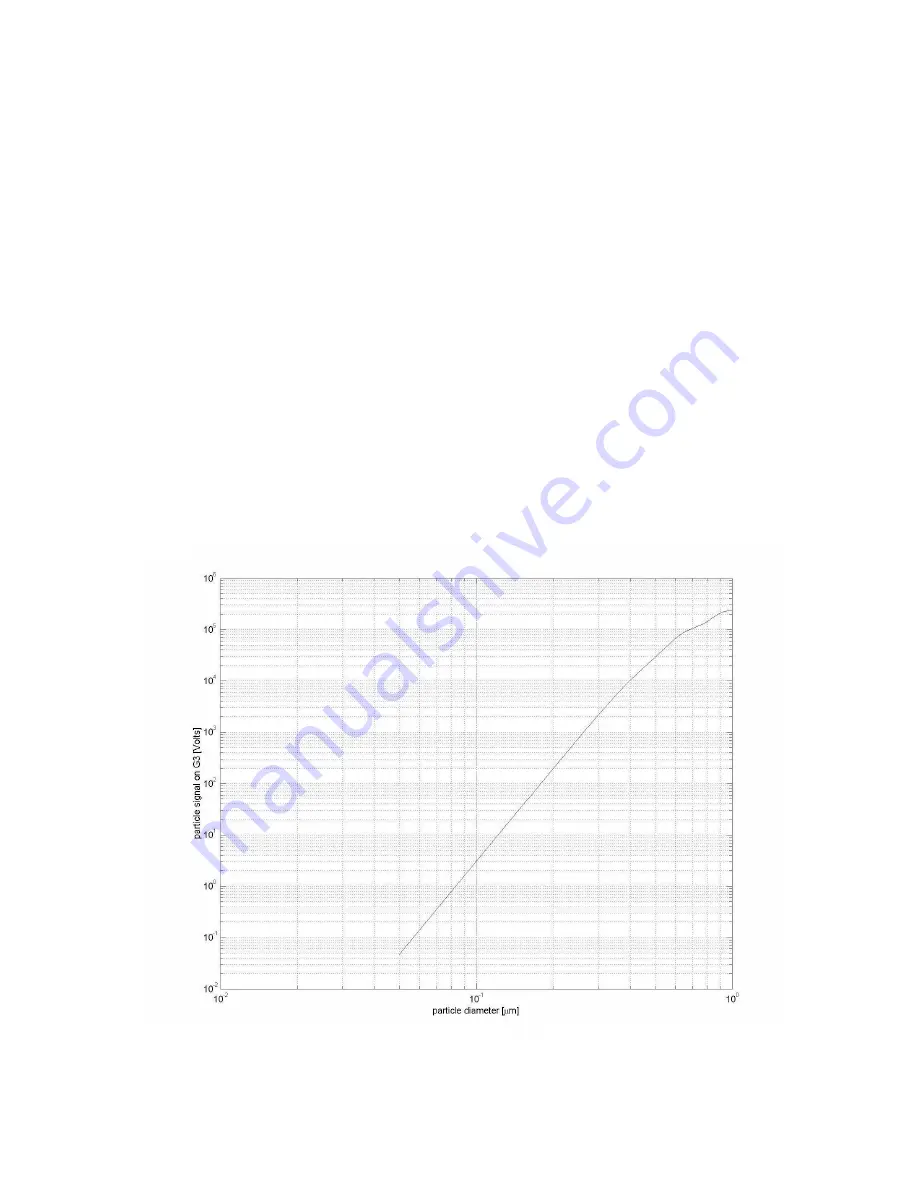
In addition to the relative gains, there is an absolute calibration curve, that is, the shape of
the particle signal size (in volts) versus the particle size (in nm) from calibration
standards. Once the relative gains are known, the corrected response for the entire
instrument can be formed. Since the wavelength of the instrument is 1054 nm, it is
expected that all particles below approximately 200-300 nm will lie on a sixth-power
curve, that is, the particle signal is a sixth-power of the particle size. This has been hard-
coded into the instrument by forcing the signals from G3, G2 and G1 to fall on a sixth-
power curve. The final gain stage, G0, used for particles from 300 to 1000 nm has a Mie
curve appropriate for the scattering response of the instrument (see Figure). It is a
complicated function which is calculated and confirmed by test particle measurement.
It’s accuracy is questionable. In the event that the user has a preferred curve (empirical
or theoretical) with, for example, a different index of refraction), this curve can be
entered instead.
Figure: Example calibration curve


