4
11
Function
Code
Name
Setting Range
Factory
Setting
Description
0:Water Supply 1:Pumping
b02.02
0~1
0
PID Output
Characteristics
Determining the strength of PID
regulation, KP is bigger, regulation is
stronger but fluctuates easily
b02.03
0.00~100.00 2.50
Proportional
Gain (KP)
Bias between the feedback and the
given, determining the speed of
regulation. If K1 is bigger, regulation
is stronger
b02.04
0.00~10.00
1.00
Integral
Coefficient (KI)
Variable ratio between the feedback
and the given, KD is bigger,
regulation is stronger. Be cautious
use, for differential regulation
amplifies interference of system
b02.05
0.00~10.00
0.00
Derivative
Coefficient
(KD)
Calculating time of regulator, when
increased response sluggishly
b02.06
0.01~100s
0.10s
Sampling cycle
(T)
Max. bias of PID output value
corresponding to closed loop given
value
b02.07
0.0~100%
0.0%
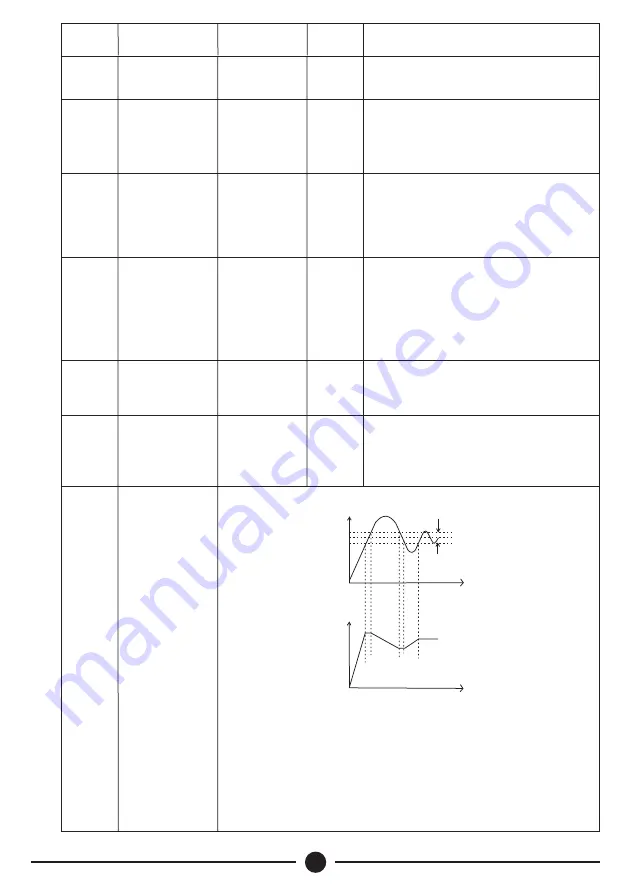
PID Control
Bias Limit
Figure 5.2 PID control curve Corresponding
S y s t e m
D i a g r a m
of Max. Limit and Output Frequency.
Properly set the value so as toregulate the
accuracy and stability of PID system.
Bias Limit
(PID stops
regulating)
Feedback
Set
point
t
t
Output
F
requency


