


20040801
u
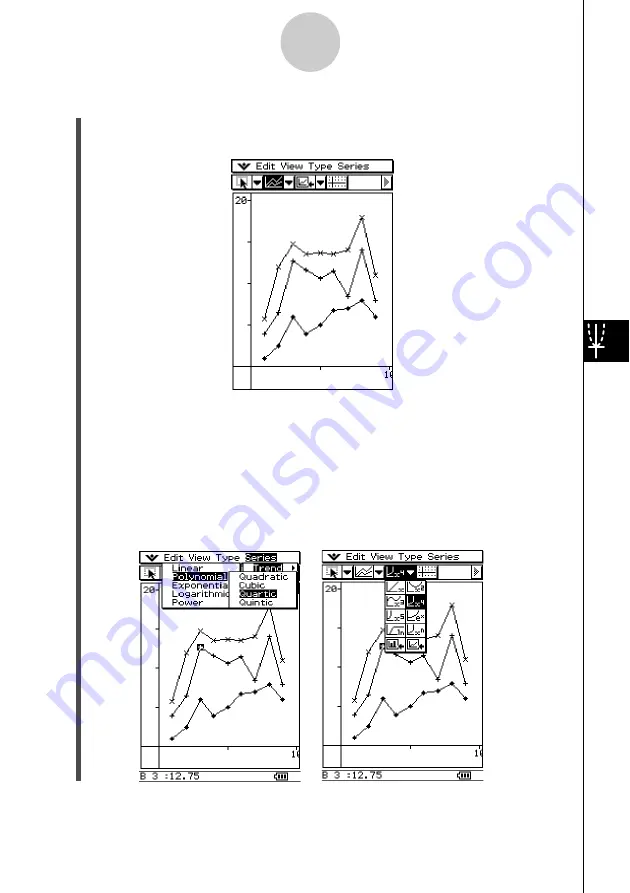
To display a regression curve
(1) Draw a clustered line graph or clustered column graph.
• A regression curve can be drawn for a line, column, or scatter graph only.
• The above shows a stacked line graph.
(2) With the stylus, tap any point of the data for which you want to draw the regression
curve.
(3) Use the [Series] menu to select the type of regression curve you want.
• You could also tap the down arrow button next to the third tool button from the left,
and tap an icon to select the regression curve type.
• See “Series Menu” on page 8-9 for information about regression curve types.
• Here, we will select quartic regression.
8-16
Graphing
Содержание Spreadsheet Application
Страница 1: ...RJA510188 4 E For ClassPad 300 Spreadsheet Application User s Guide Version 2 0 http classpad net ...
Страница 55: ...20040801 u Graph Line Clustered D u Graph Line Stacked F 8 2 Graphing ...
Страница 56: ...20040801 u Graph Line 100 Stacked G u Graph Column Clustered H 8 3 Graphing ...
Страница 57: ...20040801 u Graph Column Stacked J u Graph Column 100 Stacked K 8 4 Graphing ...
Страница 58: ...20040801 u Graph Bar Clustered L u Graph Bar Stacked 8 5 Graphing ...
Страница 74: ...CASIO COMPUTER CO LTD 6 2 Hon machi 1 chome Shibuya ku Tokyo 151 8543 Japan SA0410 B ...


