


20041001
To do this:
Tap this
Or select this
toolbar button:
[Series] menu item:
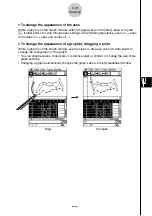
Display a linear regression curve
d
Trend - Linear
Display a quadratic regression curve
f
Trend - Polynomial -
Quadratic
Display a cubic regression curve
g
Trend - Polynomial -
Cubic
Display a quartic regression curve
h
Trend - Polynomial -
Quartic
Display a quintic regression curve
j
Trend - Polynomial -
Quintic
Display an exponential A
e
B
x
regression curve
k
Trend - Exponential
Display a logarithmic Aln(
x
) + B regression curve
l
Trend - Logarithmic
Display a power A
x
B
regression curve
;
Trend - Power
Convert the data of the selected column to a
z
Line
line graph
Convert the data of the selected line to a column
'
Column
graph
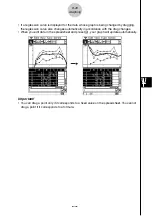
Important!
• Exponential and logarithmic regression curves ignore negative values when calculating the
curve. A message appears in the status bar to let you know when negative values are
ignored.
8-10
Graphing
Содержание Spreadsheet Application
Страница 1: ...RJA510188 4 E For ClassPad 300 Spreadsheet Application User s Guide Version 2 0 http classpad net ...
Страница 55: ...20040801 u Graph Line Clustered D u Graph Line Stacked F 8 2 Graphing ...
Страница 56: ...20040801 u Graph Line 100 Stacked G u Graph Column Clustered H 8 3 Graphing ...
Страница 57: ...20040801 u Graph Column Stacked J u Graph Column 100 Stacked K 8 4 Graphing ...
Страница 58: ...20040801 u Graph Bar Clustered L u Graph Bar Stacked 8 5 Graphing ...
Страница 74: ...CASIO COMPUTER CO LTD 6 2 Hon machi 1 chome Shibuya ku Tokyo 151 8543 Japan SA0410 B ...


