


9-29
Item
Description
Frequency
Specifies the range cells that contain values indicating the frequency
of each graph data item. Select
1
(1) if you do not want to use
frequency values.
Mark Type
Specify the type of mark (
, , or
) to use as the mark on the
scatter plot.
3. Use
f
and
c
to move the highlighting to the setting item you want to change. On the
function menu that appears, select the setting you want.
• For details about the StatGraph1, Graph Type, and Mark Type settings, see “To display the
general graph settings screen” (page 6-3).
• If you want to change the XCellRange, YCellRange, or Frequency setting, move the
highlighting to the item you want to change and then input the cell range directly, or select
1
(CELL) (
2
(CELL) for Frequency) and then edit the currently input range. When
inputting a cell range manually, use
1
(:) to enter a colon (:) between two cells that define
the range.
4. After configuring the required settings, press
J
or
w
.
k
Example of Statistical Calculation Operation (CALC Menu)
This example uses the data from the “Drawing a Scatter Diagram and
xy
Line Graph” (page
6-15) to perform paired-variable statistical calculations.
0.5, 1.2, 2.4, 4.0, 5.2 (
x
-data)
–2.1, 0.3, 1.5, 2.0, 2.4 (
y
-data)
u
To perform paired-variable statistical calculations and regression
calculations
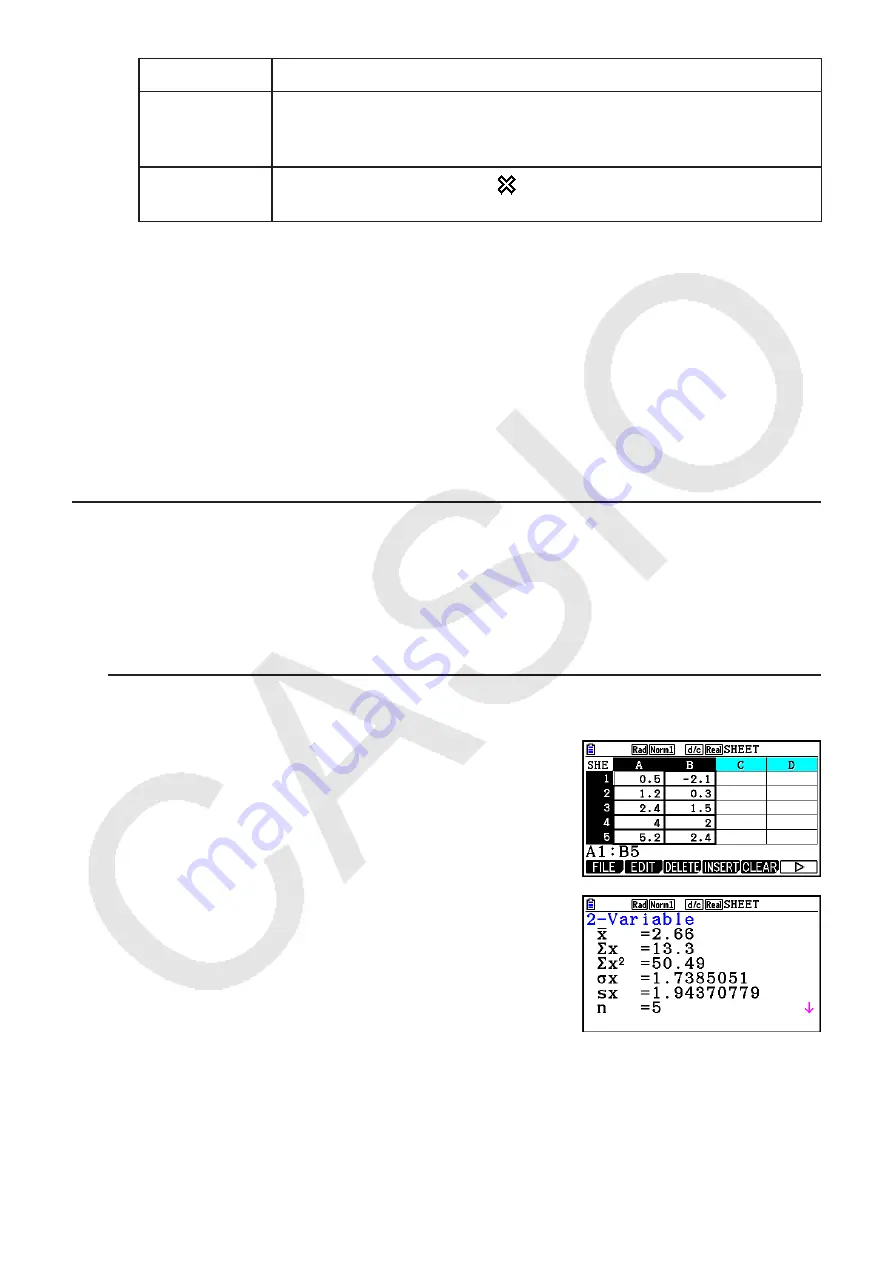
1. Input the above
x
-data into cells A1:A5 of the
spreadsheet and the
y
-data into cells B1:B5, and then
select the range of the cells where you input the data (A1:
B5).
2. Press
6
(
g
)
2
(CALC) to display the CALC menu, and
then press
2
(2-VAR).
• This will display a screen of paired variable calculation
results based on the data you selected in step 1. Use
c
and
f
to scroll the result screen. To close the
screen, press
J
.
• For information about the meaning of each of the values on the result screen, see
“Displaying the Calculation Results of a Drawn Paired-Variable Graph” on page 6-22.
3. To return to the spreadsheet screen, press
J
.
Содержание FX-CG10
Страница 555: ...E CON3 Application English...


