


Chapter 3: Graph & Table Application
99
2. Configure the dialog box with the following settings.
To specify this:
Perform this operation:
Line type
Tap “Graph Plot” and then tap the desired line type.
Line color
Tap “Line Color” and then tap the desired color.
3. To apply the settings, return to the dialog box in step 2 of this procedure and then tap [OK].
Shading the Region Bounded by Two Expressions
You can shade the region bounded by two expressions by specifying [ShadeType] as the function type and
then inputting the expressions in the syntax shown below.
{lower function
f
(
x
), upper function
g
(
x
)} | A <
x
< B
Note:
A
<
x
< B can be omitted. A <
x
< B can be replaced with
x
> A or
x
< B.
u
To shade the region bounded by two expressions
1. Tap [Type] - [ShadeType].
2. Use the above syntax to input two
x
-variable expressions, specify the
x
-value range, and then press
E
.
Example: {
x
2
– 1, –
x
2
+ 1} | –1 <
x
< 1
3. Tap
$
to graph.
0301
To use the draw shade dialog box to shade the region bounded by
x
2
– 1 and –
x
2
+ 1
Overlaying Two Inequalities in an Intersection Plot / Union Plot
Use the following procedure to overlay two inequalities in an Intersection Plot or Union Plot, which are
described below.
Intersection Plot:
Only the parts of the inequalities that overlap are shaded.
Union Plot:
The inequalities are overlaid as they are.
u
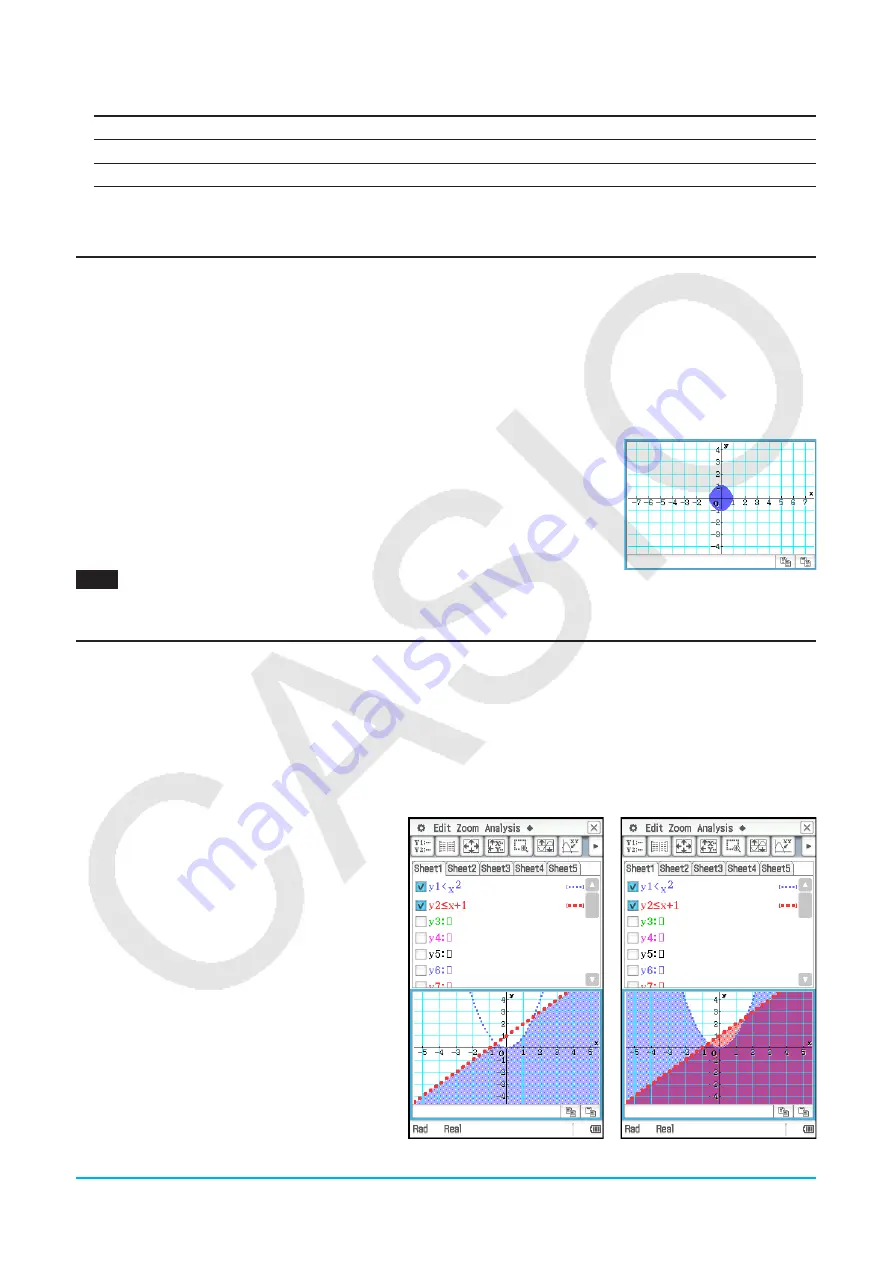
To overlay two inequalities
y
<
x
2
,
y
s
x
+ 1
1. Store
y
<
x
2
in line
y
1 and
y
s
x
+ 1 in line
y
2.
2. On the
O
menu, tap [Graph Format].
3. On the Graph Format dialog box that
appears, tap the [Inequality Plot] down
arrow and then select [Intersection] or
[Union].
4. Tap
$
to graph.
Intersection Plot
Union Plot


