


Chapter 7: Statistics Application
128
Chapter 7:
Statistics Application
The Statistics application provides you with the tools you need to perform the operations below.
Statistical data input
(as list variables)
Statistical graph drawing:
Single-variable statistical graphs and paired-variable
statistical graphs
Statistical calculations:
Single-variable, paired-variable, regression, test,
confidence interval, and distribution calculations
Tip:
Performing a statistical calculation, graphing operation or other operation causes calculation results to be assigned to
pre-determined system variables. For more information, see the “System Variable Table” on page 263.
7-1
Using Stat Editor
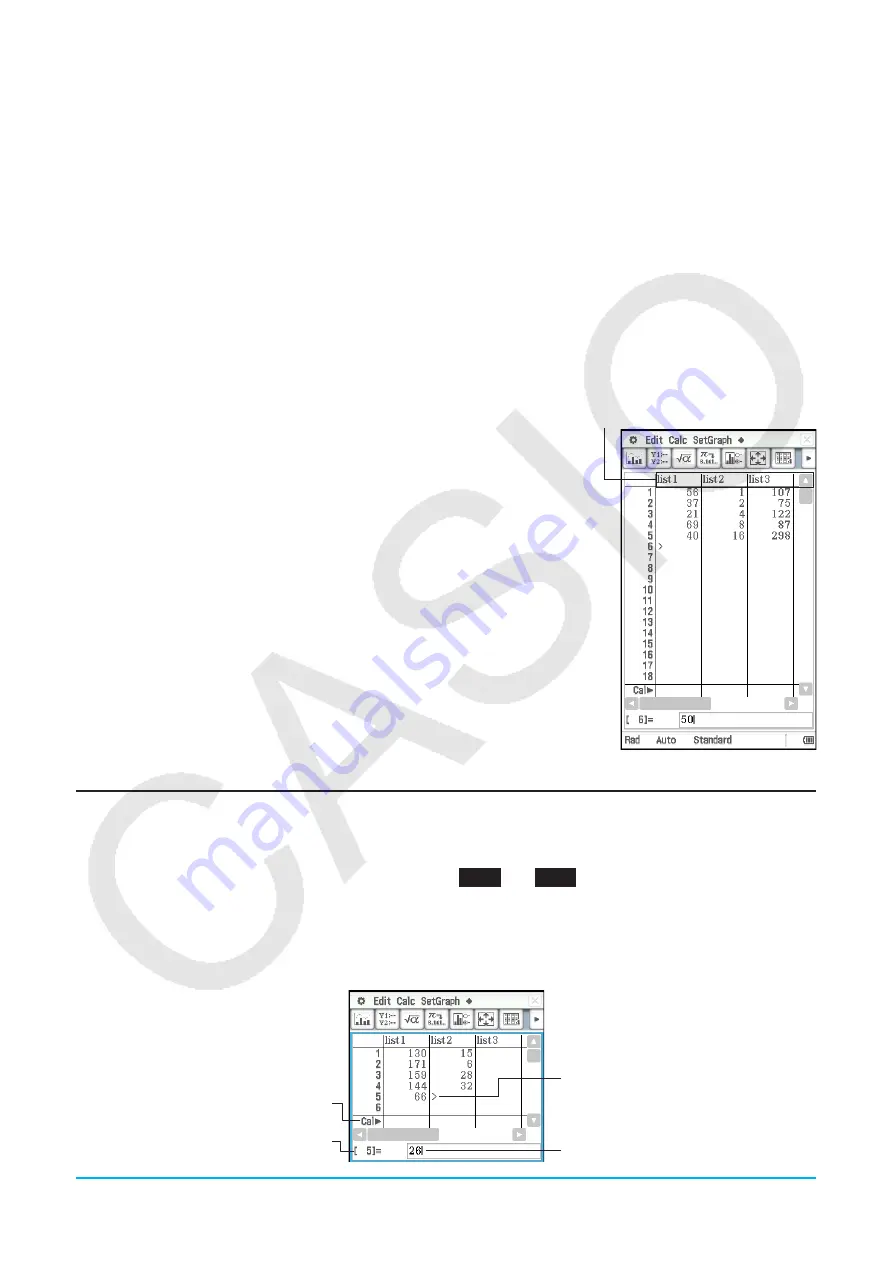
When you start up the Statistics application, the Stat Editor window shown
to the right appears on the display.
Stat Editor is a tool for creating and maintaining lists (list variables), and it
plays a very important role in ClassPad statistical calculations. ClassPad
uses lists as data sources for statistical calculations and for statistical
graphing. You can specify data by its list name.
The list name is located in the cell at the top of each list. The initial default
Stat Editor window shows six lists (columns), named list1 through list6.
List name
Basic List Operations
You can use the Stat Editor window to input and edit the data in the initially displayed list1 through list6. You
can also recall list variables you created with the Main application* and create new list variables.
*
See
0239
and
0240
in the separate “Examples” booklet.
u
To input data into a list
1. On the Stat Editor window, select the cell where you want to input the data item.
• Use the cursor key to move the highlighting, or tap the cell with the stylus.
“Cal
'
” line
(see
Tip
on the
next page)
Number of line where
data is being input
Cell where data is being input
Input data


