


Chapter 13: Spreadsheet Application
235
• This superimposes the regression graph on the scatter graph. Also, the
regression calculation result window will appear in the upper half of the
display (except for Quintic Reg).
• Here, you can add a another regression graph by selecting a different
[Calc] menu item. Also, you can repeat step 3 to overlay a regression
graph for a different
y
-value.
5. To clear all regression graphs, tap [Edit] - [Clear All].
• You can also delete a particular regression graph by tapping to select it,
and then tapping [Edit] - [Delete].
Tip
• Regression graphs are normally drawn in blue, but you can change the color after drawing is complete. To change the
color after drawing is complete, tap the graph and then tap [Edit] - [Style] to display the Style Settings dialog box. Perform
the procedure under “To specify the graph drawing color on the Graph window” (page 230) to change the color.
• Exponential and abExponential regression curves ignore negative values when calculating the curve. A message appears
in the status bar to let you know when negative values are ignored.
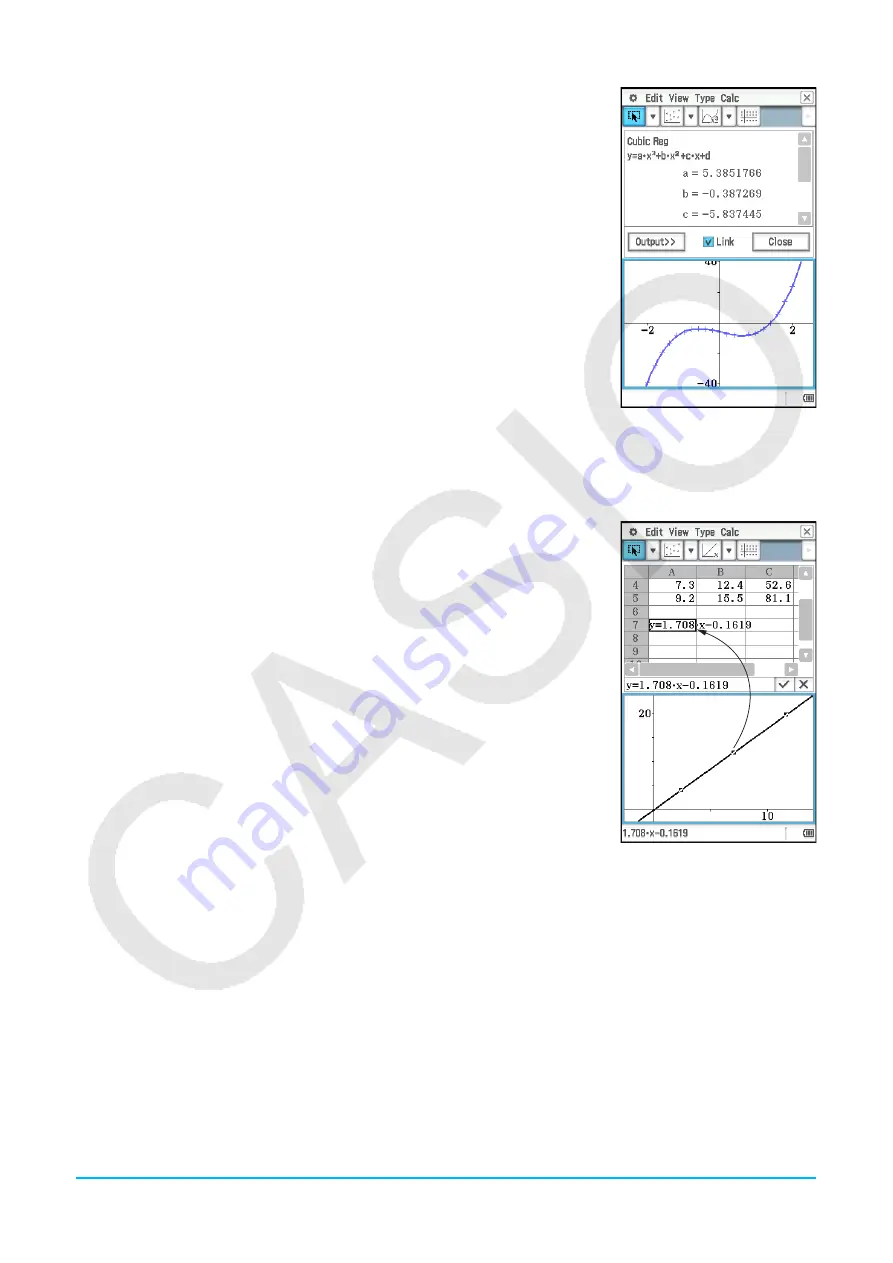
• On the Graph window, after tapping a regression graph to select it you can drag it to
the Spreadsheet window and drop it into a cell to paste the function of the regression
graph into the cell. You can also achieve the same result by tapping the regression
graph, tapping [Edit] - [Copy] (or [Edit] - [Cut]), tapping a cell in the Spreadsheet
window, and then tapping [Edit] - [Paste]. Note that if you perform an [Edit] - [Cut]
operation, the regression graph will be deleted from the Graph window.
• For details about how to use the Link check box and [Output>>] button on the
regression calculation result window, see “To execute a regression calculation and
paste the results into the spreadsheet” (page 238).


