EN
UVIX suite User Manual
16
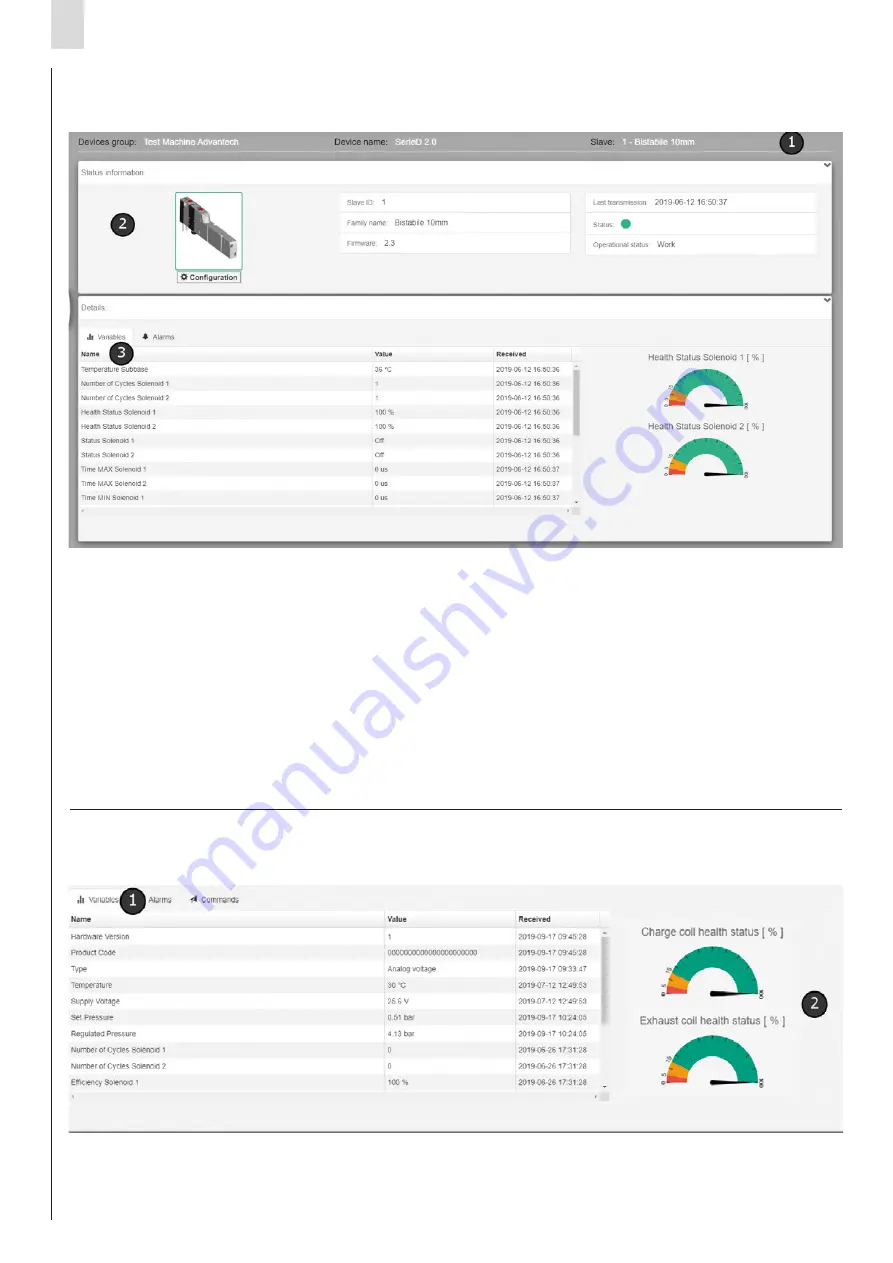
In order to access slave management, if present, it is necessary to select
it from the treeView present in the left bar.
The slave management page is divided into 3 macro areas:
• Header
[1]
: displays a description of the slave, formed by the Slave ID
and the description of the type, as well as the group of devices to which
it belongs.
• Status information
[2]
: displays the following fields related to the
selected slave.
- An image which represents it with its coloured border based on its
overall status.
-
Slave ID
: identification of the slave within the device.
-
Family name
: description of the type.
-
Firmware
: firmware version.
-
Last trasmission
: date and time of the last data received.
-
Status
-
Operational status
- Under the image of the slave, there may be a “Configuration” button,
which allows the user to open the configuration window of the
selected slave.
• Details
[3]
: it is divided into two tabs:
-
Variables
: consisting of a table showing the variables sent by the device
accompanied by their value and the date of receipt. For more information,
see the paragraph "Variables".
-
Alarm
: consisting of a table showing all possible alarms that the slave may
trigger. For more information, see the paragraph "Alarms".
The variables section is accessed from the device/slave management
page by clicking on the Variables tab
[1]
.
The variables are listed in the form of a table and the following information
is shown for each variable:
• Name: name of variable.
• Value: value taken by the variable.
• Received: date/time at which the last information relating to the variable
was received.
Some variables, if considered particularly important, may have a dedicated
display through the use of indicators
[2]
.
3.5
Slave management
3.6
Variables


