background image

System Overview

2-1

2

S

YSTEM

 O

VERVIEW

The DektakXT

® 

stylus surface profiler is an advanced thin and thick film step height measurement 

tool. In addition to profiling surface topography and waviness, the DektakXT system measures 
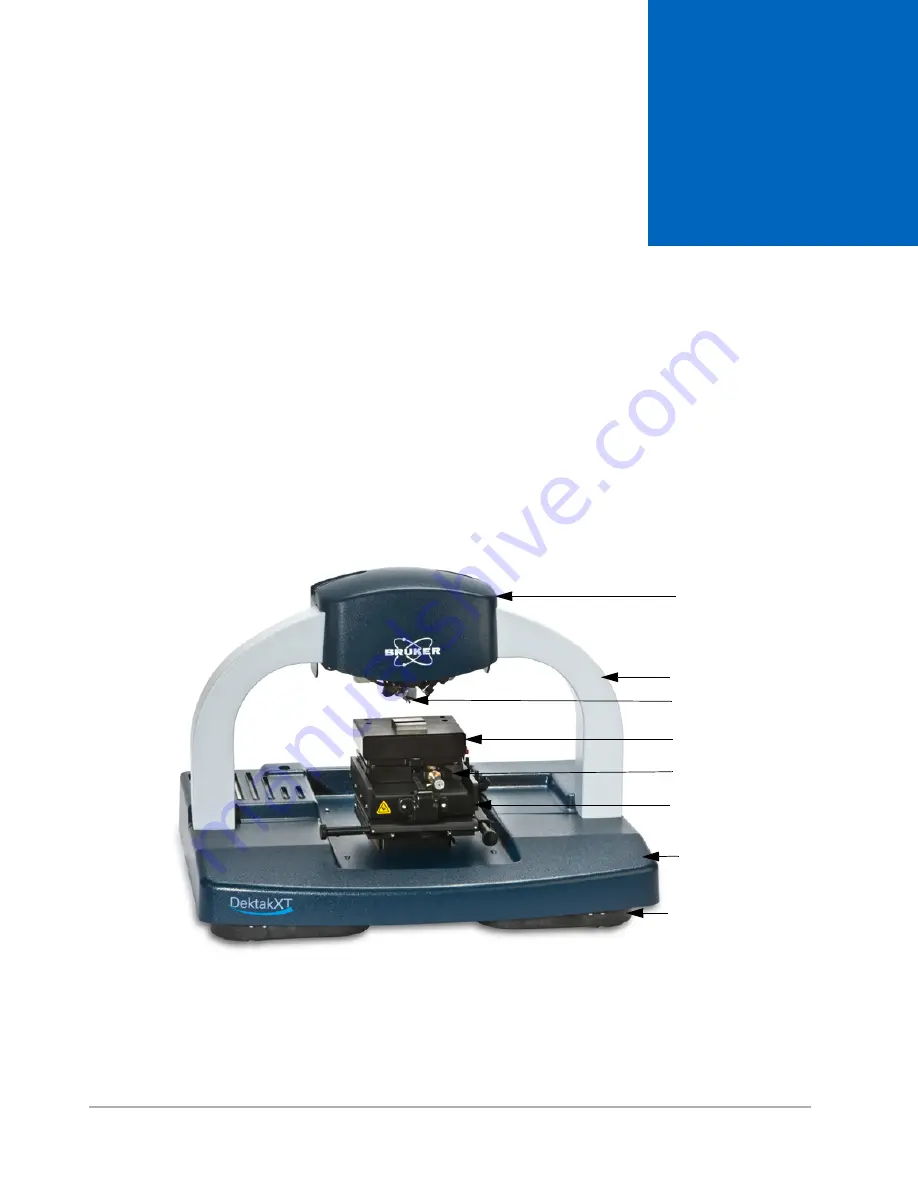
roughness in the nanometer range. Available with a standard manual sample-positioning stage (see 

Figure 2-1

) or an optional automatic X-Y or theta stage (see 

Figure 2-3

), it provides a step-height 

repeatability of 5Å (<0.6 nm).
In addition to taking two-dimensional surface profile measurements, the DektakXT system can 
produce three-dimensional measurements and analyses when equipped with the 3D Mapping Option. 

Figure 2-1:  DektakXT Stylus Profiler with the Standard Manual X-Y Sample-Positioning Stage

Hood-covered 
measurement 
head that 
includes the 
tower, camera, 
illuminator, and 
sensor

Scan stage

System base

Sensor head and 
stylus

Manual sample-
positioning stage

Block sample 
fixture (chuck)

Base foot

Bridge

Содержание DektakXT

Страница 1: ......

Страница 2: ...P N 980 365 DEKTAKXT STYLUS PROFILER USER MANUAL ...

Страница 3: ... authority Offenders will be liable for damages All rights reserved All configurations and specifications are subject to change without notice TRADEMARK NOTICE Vision64 is a registered trademark of Bruker Corporation All other brand or product names are trademarks or registered trademarks of their respective holders Bruker Nano Surfaces Business 2650 East Elvira Road Tucson Arizona 85756 Phone 520...

Страница 4: ... parts or software These services will be performed at Seller s option at either Seller s facility or Buyer s business location For repairs performed at Seller s facility Buyer must contact Seller in advance for authorization to return equipment and must follow Seller s shipping instructions Freight charges and shipments to Seller are Buyer s responsibility Seller will return the equipment to Buye...

Страница 5: ...nsequential damages for anticipated or lost profits incidental indirect special or punitive damages loss of time loss of use or other losses even if advised of the possibility of such damages incurred by Buyer or any third party in connection with the equipment or services provided by Seller In no event will Seller s liability in connection with the equipment or services provided by Seller exceed ...

Страница 6: ...Procedure 1 5 Returning the System to Operation 1 5 Electrical Task Classification 1 5 Chapter 2 System Overview 2 1 How the System Works 2 2 Stage Configurations 2 2 Profiler Components 2 3 Measurement Head 2 3 Sensor Head and Stylus Assembly 2 4 Sample Positioning Stage 2 4 Scan Stage 2 4 Electronics 2 4 Base Feet 2 5 Environmental Enclosure 2 6 EMO Box 2 6 Computer and Software 2 7 Options and ...

Страница 7: ... Manual 2D Measurement 4 4 What Happens During a Scan Measurement 4 7 Creating an Automation Recipe that Includes Deskew Points 4 10 Appending Analytical Functions 4 13 Setting the Cursor Locations and Bandwidths 4 14 Applying Software Leveling 4 16 Creating a Database 4 18 Creating an Analyzer Recipe 4 20 Using the Data Analyzer and Analysis Toolbox 4 20 Setting the Parameters for an Analysis or ...

Страница 8: ...Table of Contents v Applying Filters 5 11 Performing Analyses 5 12 3D Mapping Optiion 5 13 ...

Страница 9: ......

Страница 10: ...ton located on the EMO box see Figure 1 1 This unit may be placed in any convenient and readily accessible location Pressing the EMERGENCY OFF button shuts off DC power to the system devices excluding the computer monitor and power supply adapter The 24 VDC control circuit in the EMO Box also remains energized CAUTION Whenever you see a Caution note there is a possibility that data will be lost or...

Страница 11: ... is designed to minimize potential health and safety hazards during normal operation and routine maintenance activities As with any mechanical system that uses electrical energy and compressed air it contains some physical and electrical hazards You should be aware of these potential hazards and the controls used to minimize them Review this section and contact Bruker if you have any questions on ...

Страница 12: ...Safety 1 3 injury or damage to the system The following table illustrates each label describes its meaning and indicates where it appears on the system Table 1 1 Warning Safety and Compliancy Labels ...

Страница 13: ...differential between the gas in the line and the surrounding atmosphere will cause the gas to be forcefully expelled into the surrounding atmosphere This can cause physical injuries due to particles flying outward with extremely high speed The DektakXT system uses compressed clean dry air CDA to operate the optional vibration isolation table It is designed to use CDA at the typical house supplied ...

Страница 14: ...to verify that all electrical sources have been locked out If properly locked out no voltage should be present Check the reading on supply line pressure gauges to verify that no pressure exists within the system If properly locked out no pressure should exist 11 Perform maintenance work Returning the System to Operation 1 Verify that all personnel materials tools and test equipment are clear of th...

Страница 15: ...NCY OFF button Table 1 2 Classification of Operator Tasks Task Type Description Type 1 Equipment is fully de energized Type 2 Equipment is energized Energized circuits are covered or insulated Type 3 Equipment is energized Energized circuits are exposed and inadvertent contact with uninsulated energized parts is possible Potential exposures are no greater than 30 volts rms 42 4 volts peak 60 volts...

Страница 16: ...or theta stage see Figure 2 3 it provides a step height repeatability of 5Å 0 6 nm In addition to taking two dimensional surface profile measurements the DektakXT system can produce three dimensional measurements and analyses when equipped with the 3D Mapping Option Figure 2 1 DektakXT Stylus Profiler with the Standard Manual X Y Sample Positioning Stage Hood covered measurement head that includes...

Страница 17: ... within the assessment length If there is an active database selected analytical functions are logged to it during each measurement STAGE CONFIGURATIONS The DektakXT stylus surface profiler comes in the following stage configurations The standard 2 D DektakXT system which includes a two axis manual sample positioning stage with 101 6 x 101 6 mm 4 x 4 inches of X Y translation manual leveling two p...

Страница 18: ...the DektakXT stylus surface profiler system contains all of the mechanical electrical and optical components for sample positioning sample viewing and scanning measurement As described in Stage Configurations on page 2 2 the system can be configured with a manual or X Y auto stage Its sturdy single arch bridge design reduces sensitivity to adverse environmental conditions Measurement Head The hood...

Страница 19: ...stylus for another without damaging the delicate tip Figure 2 4 Sensor Head and Stylus Assembly Sample Positioning Stage Available sample positioning stages and sample fixtures chucks are discussed in Stage Configurations on page 2 2 Scan Stage The direct drive scan stage accelerates measurements by reducing the time between scans This allows for the generation of large 3D maps or long scans for m...

Страница 20: ...ated cable connector panel handles system input output and power signals Power demand is 110 VA maximum with a standard outlet power connection Figure 2 5 Power Supply Adapter Figure 2 6 Signal Processor Base Feet The standard urethane polymer base feet see Figure 2 7 help isolate the system from the surrounding vibrational environment Figure 2 7 Standard Base Foot ...

Страница 21: ...ts The front door lifts to provide sample access The system should always be operated with the enclosure door closed Figure 2 9 Environmental Enclosure with the Door Closed EMO Box An Emergency Machine Off box EMO Box includes POWER OFF and POWER ON buttons along with an EMERGENCY OFF button see Figure 2 10 The EMERGENCY OFF button cuts off power to the DektakXT system but leaves power on to the c...

Страница 22: ...rement and analysis software see Figure 2 11 has 64 bit parallel processing architecture It allows you adjust the system illumination position a sample under the stylus take single scan or automated measurements see Figure 2 12 calculate analytical functions apply analyses and filters and perform special operations such as comparing the analytical results from multiple scans For an introduction to...

Страница 23: ...ng A video monitor that provides a 23 inch high resolution flat panel color display see Figure 2 13 It shows programs and graphics in full color along with a color video image of the sample surface from the USB camera in the tower assembly Figure 2 13 Video Monitor The X Y auto stage described in Stage Configurations on page 2 2 A broad line of calibration standards see Figure 2 14 ...

Страница 24: ...n processed wafers The 3D Mapping Option that enables true 3D mapping see Figure 2 15 calculates the bearing ratio and performs many other analyses 200 mm 7 8 inch data stitching software for increasing the scan length to 150 mm or longer with multiple stitching operations available only on systems that include the X Y auto stage Figure 2 15 2D Contour Plot Generated with the 3D Mapping Option ...

Страница 25: ......

Страница 26: ...n simply press the white ON button on the EMO Box turn on the computer and monitor and then start the Vision64 software To power up the DektakXT system 1 Verify that the cable from power supply adapter is connected to a wall outlet 2 Verify that all USB cables are connected 3 Verify that the software key is installed in a USB port of the computer see Figure 3 1 The software key is shipped inside t...

Страница 27: ... illuminate 6 Press and release the power button on the front of the computer 7 Turn on the monitor and power up the computer 8 Select Start Vision64 or click the Vision64 application button on the desktop or task bar As the software launches the following events occur The tower assembly moves to its upper limit The system stops with the stylus in the Tower Up position The scan stage initializes Y...

Страница 28: ...e this box in any convenient and readily accessible location Pressing the EMERGENCY OFF button immediately shuts off power to all system components excluding the computer monitor and power supply adapter The 24 VDC control circuit in the EMO Box also remains energized After you power down the system via the EMO box you must exit Vision64 shut down the computer and turn off the monitor as described...

Страница 29: ... Live Video Display to move the scan stage forward 55mm two inches You can now conveniently place a sample on the sample fixture see Figure 3 6 remove it without risk of damage to the stylus or the sample Click the Load Sample button to move the scan stage backward its home position Use the manual or auto stage controls to fine position the area of interest on the sample beneath the stylus For ins...

Страница 30: ...utton NOTE The DektakXT profiler automatically towers down to bring the stylus into contact with the sample whenever you start a single scan measurement 3D map scan or automation program ADJUSTING THE ILLUMINATION After lowering the tower to focus the camera on your sample you must adjust the illumination level of the video image displayed on the monitor To do this move the slider on the Intensity...

Страница 31: ...arse X movement Pull the lever below the left side of the platform for coarse Y movement Use the respective knobs to finely position the sample Figure 3 8 X Y Positioning Levers on the Manual Sample Positioning Stage NOTE After fine tuning the scan site using the X and Y positioning levers you may have to re null the tower to adjust for skew To re null the tower tower up and then tower down Leveli...

Страница 32: ...ange to 5240kÅ Level the trace change to the intermediate range and then repeat the procedure until the stage is leveled The best level is achieved by using the 6 5kÅ range USING THE AUTO STAGE POSITIONING CONTROLS When you open Vision64 the Live Video Display appears by default On its right hand side it contains two instrument control panels the X Y Control Panel and the Theta Control Panel X Y C...

Страница 33: ...elect the Grab Circle to Move check box you must grab the red circle in the middle of the X Y Control Panel before you can adjust the X Y position of the motorized stage When your settings are complete click OK Figure 3 11 X Y Options Dialog Box 2 In the lower right corner click the speed at which you want the stage to travel 3 Do one of the following Holding down the left mouse button drag the re...

Страница 34: ...justing the position of the motorized theta sample positioning stage Instructions for doing this appear after the figure Figure 3 12 Theta Stage Control To set the position of the motorized theta sample positioning stage 1 In the Theta Control Panel in the Live Video Display see Figure 3 12 click the blue Gear icon in the upper right corner to enter the units as well as the speeds for Fast Medium ...

Страница 35: ...n the box below the ring This position is graphically depicted by the moving red indicator on the yellow ring 3 When you have obtained the correct stage position release the mouse button REMOVING AN INSTALLED STYLUS When a stylus becomes worn or you want to measure another type of sample you must remove the currently installed stylus from the sensor head see Figure 3 18 before replacing it with a ...

Страница 36: ... Home position to allow room for maneuvering 4 On the profiler turn the brass thumbscrew on the left side of the sensor head counter clockwise to loosen the sensor head magnetic shield see Figure 3 16 Figure 3 16 Sensor Head with Magnetic Shield Attached 5 Slip the shield off the pin on the right side of the sensor head 6 Carefully move the shield toward the front of the profiler and pull it off t...

Страница 37: ...tool Figure 3 19 Stylus Exchange Tool Flush with the Bottom of the Sensor Head 10 Rotate the thumbscrew on the left side of the stylus exchange tool so that a green circle becomes visible and the magnet is engaged The magnet now pulls the stylus into the channel on the exchange tool see Figure 3 18 Lower the exchange tool containing the stylus from the bottom of the sensor head and take it to the ...

Страница 38: ...STALLING A DIFFERENT STYLUS NOTE The following instructions assume that you have already removed the magnetic shield from the sensor head on the DektakXT profiler If this is not the case follow steps 4 6 in the previous section 1 Tower up to the Home position to allow room for maneuvering 2 Locate the stylus exchange tool If its green circle is visible rotate the thumbscrew in either direction to ...

Страница 39: ...CK END see Figure 3 22 Figure 3 22 Lifting the Stylus from Its Case 4 Align the magnetic disk pad of the stylus with the magnetic disk pad on the stylus exchange tool see Figure 3 21 5 Seat the stylus in the channel on the exchange tool The stylus arm should extend out through the front channel on the exchange tool see Figure 3 23 l Alignment pin one of five Magnetic disk pad Channel for holding t...

Страница 40: ...f the sensor head The ridge at the back of the stylus exchange tool must roughly line up with the back of the sensor head Figure 3 24 Stylus Exchange Tool Flush with the Bottom of the Sensor Head 8 Disengage the magnet by rotating the thumbwheel in either direction so that a gray circle replaces the green one 9 Lower the stylus exchange tool 10 Position the magnetic shield on the thumbscrew shaft ...

Страница 41: ... on the chuck or stage remove it 3 Clean the stylus tip using a lint free synthetic cotton swab which will not leave any fibers on the stylus Moisten the swab with deionized water or laboratory grade isopropyl alcohol Lightly touch the stylus tip with the synthetic cotton swab to remove any dust You may also use a small soft bristle paintbrush Do NOT use an air gun Brass thumb screw on sensor head...

Страница 42: ... you through the process of calibrating the force with which the stylus tip contacts the sample The Vertical Calibration wizard guides you through the procedure of taking a height or depth measurement and comparing the results with a calibration standard s certified value An average measured value that is within 0 5 of the certified value ensures that your DektakXT system is taking accurate measur...

Страница 43: ...hen the power is on Do not lower the tower without the stage assembly in place Do not move a sample during a scan measurement Avoid vibration and shock during measurements For example ensure that an operator does not bump a surface close to the profiler or the profiler itself during a measurement Always raise the tower to the maximum vertical position when the system is not in use ...

Страница 44: ...ata 4 1 4 TAKING MEASUREMENTS AND ANALYZING DATA This chapter tells you how to take manual and automated scan measurements It also explains the manipulation and analysis of scan data Figure 4 1 DektakXT System with an Open Enclosure Door ...

Страница 45: ...ns Tab Scan Type Select from the following Standard Scan A normal scan type in which the scan is performed across the surface of a sample Because the tower is nulled before each scan each successive scan has its own reference point Static Tower Scan A special scan type in which the scan is performed across the surface of a sample but the tower is nulled before only the first scan Each successive s...

Страница 46: ...out of level Hills Provides 90 of the measurement range above the horizontal grid line This option is used primarily for measuring step heights NOTE When setting up ranges and scan profile types always think about keeping the stylus trace from topping out or bottoming out in the Data Acquistion window Stylus Type Select the currently installed stylus type from the drop down list Stylus Force Enter...

Страница 47: ...described in the online Help IMPORTANT Always operate the DektakXT inside its acrylic environmental enclosure see Figure 4 1 This enclosure protects the sample and scan area from adverse outside influences such as noise vibrations dust and air currents Always operate the system with the enclosure door closed 1 In the Vision64 Measurement Setup window do one of the following If your system includes...

Страница 48: ...ing a step height standard the step must run horizontally across the Live Video Display Samples such as metals should be positioned so that the lay the predominant direction of the surface texture runs horizontally across the Live Video Display NOTE Because the scan will move Up in the Live Video Display the trace must be positioned above the stylus thus ensuring that it will be fully measured 9 O...

Страница 49: ...4 5 and then select Measurement The events that now occur are described in What Happens During a Scan Measurement on page 4 6 Figure 4 5 Measurement Buttons 13 Observe the measurement in real time in the Data Acquisition window If the scan hits or exceeds the top or bottom border of the Data Acquisition window adjust the tilt on the scan stage see Figure 4 6 and or increase the Scan Range value in...

Страница 50: ...a Analysis window appears see Figure 4 6 If desired click Save Dataset Figure 4 7 Data Analysis Window What Happens During a Scan Measurement When a measurement begins the tower assembly lowers and the stylus descends You can see the stylus and its shadow in the Live Video Display see Figure 4 7 Stage leveling knob ...

Страница 51: ...n is set for Hill or Valley the process described above is somewhat different For example during a measurement with the 3D Mapping package a real time picture of the sample appears during data collection see Figure 4 9 After the scan measurement is complete the Data Analysis Display appears see Figure 4 10 The surface features encountered by the stylus are represented as a two dimensional profile ...

Страница 52: ...ements and Analyzing Data 4 9 Figure 4 9 Live Video of the Stylus with the Real Time Measurement Trace on the Right Figure 4 10 Real Time Picture of the Sample During a Measurement Taken with the 3D Mapping Package ...

Страница 53: ...eference sample as Deskew points for example the test pads on a silicon wafer or substrate corners When the system runs the Automation recipe it refers to these Deskew points to correct for variations in the positions of your samples To create and run an Automation recipe that includes Deskew points 1 Position your reference sample on the stage so that the area that you want to use as your Deskew ...

Страница 54: ... Deskew alignment point a Drive the stage to the area on the image that you want to use as the Deskew alignment point b Tower down c In the Automation Editor click the Add Alignment Site button A solid red circle now appears at that location see Figure 4 13 Figure 4 13 Setting the Deskew Alignment Point ...

Страница 55: ...this Automation recipe 8 If desired change the Automation Options at the bottom of the Automation Editor see Figure 4 15 Figure 4 15 Options at the Bottom of the Automation Editor 9 Select Save Automation Recipe Name this recipe and then click Open 10 Select Measurement Automated Measurement The system automatically runs the Deskew recipe followed by the Automation recipe 11 As the measurement seq...

Страница 56: ...ements Frequently calculated functions include ASH delta average step height horizontal distance and vertical distance You can save your selection of analytical functions to a Vision recipe so that they are automatically calculated whenever you take a manual measurement or an automated series of measurements To select analytical functions 1 On the Ribbon click the Data Analysis icon 2 With the liv...

Страница 57: ...culated 5 Click Calculate SETTING THE CURSOR LOCATIONS AND BANDWIDTHS The red reference R cursor and green measurement M cursor in the Data Analysis Display define the portion of the profile trace on which to calculate analytical functions on the measurement results see Figure 4 18 You can adjust the bandwidth at each cursor to average the data points within that cursor s bandwidth This is especia...

Страница 58: ... while maintaining the same distance between them click on one of the cursors and then hold down the Alt key while dragging that cursor The second cursor moves along with it The locations of the R Cursor and M Cursor and their bandwidths appear in a box at the bottom of the Data Analysis window see Figure 4 7 To change these settings type in new values and press Enter NOTE The numbers in the Curso...

Страница 59: ...measurements and accurate readings from analytical functions Software leveling sets the reference and measurement cursors at zero to establish a reference for measurements To software level a trace from a live measurement in the Data Analysis window 1 Click Terms Removal F Operator in the Analysis Toolbox see Figure 4 20 to add it to the Data Analyzer tree see Figure 4 21 Figure 4 20 Terms Removal...

Страница 60: ...Position the R and M cursors as far apart as possible along the baseline of the step 3 Right click and select Two Point Linear Fit rom the Data Leveling Settings pop up menu see Figure 4 22 4 The profile trace re plots and levels with the R and M cursor intercepts at zero Figure 4 22 Data Leveling Pop up Menu ...

Страница 61: ...want to include in this database 2 Click the Database Setup button and then click Create New File A Save window appears Enter a name for your database and then click Save 3 As shown in Figure 4 23 the Database Setup View window appears The currently selected analysis flow is available from nested expandable lists in the upper right corner A table to the left shows the parameters in the currently a...

Страница 62: ...sults to populate the database with the current selections or analysis parameters in the Analytical Results table 6 Click OK in the Database Setup window 7 Do one of the following Toggle to Database button on the Analyze Tab to Logging Enabled Click the General Preferences button on the Preferences set Enable Data Logging to True and then click OK A database file is now generated for each scan mea...

Страница 63: ...and Setting the Cursor Locations and Bandwidths on page 4 14 3 Select your analyses and filters in the Analysis Toolbox as explained in the next section 4 Click the Open Database button at the button of the Database window and then open the database that you want to associate with this Analyzer Recipe 5 On any Ribbon tab select Save Analyzer Recipe 6 To make this Analyzer recipe a part of the curr...

Страница 64: ...4 27 Analysis Toolbox To apply an analysis or filter click it in the Analysis Toolbox The selected operation is immediately performed on the active scan dataset In the Data Analyzer above the Analysis Toolbox the operation now appears as part of the workflow tree Analyzer recipe as shown in Figure 4 28 Figure 4 28 Workflow Tree that Includes Terms Removal F Operator and Step Detection ...

Страница 65: ...ar above the Data Analyzer CREATING A VISION RECIPE A Vision recipe contains all of the information that the system needs to make a single scan measurement It also includes the Analyzer recipe that is active when you create and save the Vision recipe so you can scan a sample and then visualize and analyze the resulting dataset with a single click To create and save a Vision recipe 1 Select a scan ...

Страница 66: ...lery see Figure 4 28 Click a thumbnail image of a dataset to make it the active one in the Data Analysis window standard DektakXT or the Main Display Area 3D Mapping Option To apply filters and analyses to the active dataset make selections in the Analysis Toolbox For instructions see Using the Data Analyzer and Analysis Toolbox on page 4 18 To save any changes to the active dataset select Save Da...

Страница 67: ......

Страница 68: ...Vision64 Welcome screen appears followed by the Vision64 Instrument tab which includes the DektakXT Live Video Display Vision64 requires a software key to run see Figure 5 1 If the key is not installed in a USB port an error message appears If this occurs install the key and restart Vision64 Figure 5 1 Software Key in a USB Port CLOSING VISION64 Click the Exit button in the upper right hand corner...

Страница 69: ...lp topic by re selecting the Help Tab The Help opens to a Table of Contents on the left and an introduction to Vision64 Help topics can be selected by clicking one of the following buttons in the left panel of the Help Tab Contents lets you browse the Table of Contents Double click on a book major heading to view its pages individual topics Double click on a page to view the topic Index lets you v...

Страница 70: ...etup Automation Setup Data Acquisition Data Analysis which includes the Data Analyzer and Analysis Toolbox if Raw Data is selected You can change the size and layout of each Vision View by clicking and dragging with the mouse You can save each configuration by clicking Save Vision Views If you save your preferred set of Vision Views as the startup it will appear each time that you start Vision64 C...

Страница 71: ...5 4 Using Vision64 Figure 5 4 Measurement Setup Vision View Figure 5 5 Automation Setup Vision View ...

Страница 72: ...Using Vision64 5 5 Figure 5 6 Data Acquisiton Vision View Figure 5 7 Data Analysis Vision View ...

Страница 73: ... live view of your sample and the stylus see Figure 5 10 The Instrument Control Panel that allows you to control the DektakXT profiler see Figure 5 11 The Active Gallery Display that simultaneously displays thumbnail views of all active datasets It appears below the Data Analysis Vision View see Figure 5 12 The Database Display that shows statistical analysis results in a comma separated variable ...

Страница 74: ...s toolbox Click an icon to immediately apply it to the active dataset Right click an icon to open an analysis setup dialog box The Analysis Toolbox is available only when Raw Data is selected in the Data Analyzer Figure 5 10 Live Video Display ...

Страница 75: ... Vision64 Figure 5 11 Instrument Control Panel for the X Y Stage Figure 5 12 Active Gallery with Multiple Datasets Data Analysis Vision View showing the selected dataset Active Gallery showing four open datasets ...

Страница 76: ...Figure 5 13 A DektakXT Database MORE FEATURES OF THE INTERFACE Application Menu Button Use this button to open the Application Menu from which you can access the most common Vision64 application functions see Figure 5 14 ...

Страница 77: ...the Instrument Tab or the Preferences Tab You can perform the functions on these tabs by clicking a button or by using keyboard shortcuts Some tabs include split buttons that provide multiple related commands Figure 5 15 Ribbon with the Analyze Ribbon Tab Selected CHANGING THE UNITS AND OTHER USER PREFERENCES You can specify different units before or after a scan measurement After you have done th...

Страница 78: ...s in the Units dialog box see Figure 3 15 and then click OK Figure 5 16 Units Dialog Box APPLYING FILTERS To apply a filter to the active dataset click Profile Filter in the Data Analyzer see Figure 5 8 or Analysis Toolbox see Figure 5 9 Then click Edit Settings in the Data Analyzer or Edit Default Settings in the Analysis Toolbox The following dialog box appears ...

Страница 79: ... the active dataset To apply a Terms Removal F Operator or Micro Form filter click it in the Analysis Toolbox seeFigure 5 9 To change the settings right click it prior to its application PERFORMING ANALYSES To perform an analysis on the active dataset click the analysis for example Bearing Ratio that you want to apply in the Analysis Toolbox see Figure 5 9 To change the analysis settings right cli...

Страница 80: ...ewhat differently than described in this chapter For example the Data Visualization Taskbar allows you to quickly change the displayed plot while the Combo Plot drop down list lets you select combination plots for display see Figure 5 19 For more information about the 3D Mapping Option see your Vision64 online Help Figure 5 19 Data Visualization Taskbar and Combo Plot Drop down List ...

Страница 81: ......

Страница 82: ... Configuring and calibrating 3 17 Electronics 2 4 Environmental enclosure 2 6 4 4 Illustrated 2 2 DektakXT Stylus Profiler cont Options and accessories 2 8 Principle of operation 2 2 Scanning operation 4 8 E Electrical task classification 1 5 Electronics 2 4 Emergency Off button 1 1 EMO box 2 6 3 2 Environmental enclosure 2 6 4 4 H Hazards Mechanical 1 4 Pressure 1 4 Help using Vision64 5 2 I Illu...

Страница 83: ...igurations 2 2 Controlling the X Y auto 2 3 Controlling the theta auto 3 9 Manually leveling 3 6 Sample fixtures chucks 2 3 Using the manual positioning controls 3 6 Step height standard 2 9 Stored data viewing and analyzing 4 23 Stylus Cleaning the tip 3 16 Removing 3 13 Installing a new 3 10 T Theta stage control 3 9 Tower assembly 2 3 Towering up and down 3 5 Turning on the system 3 1 U Units c...

Отзывы: