


User Guide e-CELSIUS Performance.2
EN
27
Picture 26: Picture of the curves obtained on the e-performance Manager software after the data unloading.
It is possible to move on the graph by keeping key Alt pressed and clicking the left mouse
button while sliding it from the left to the right.
7.1.2
Markers from the e-Viewer
®
performance monitor
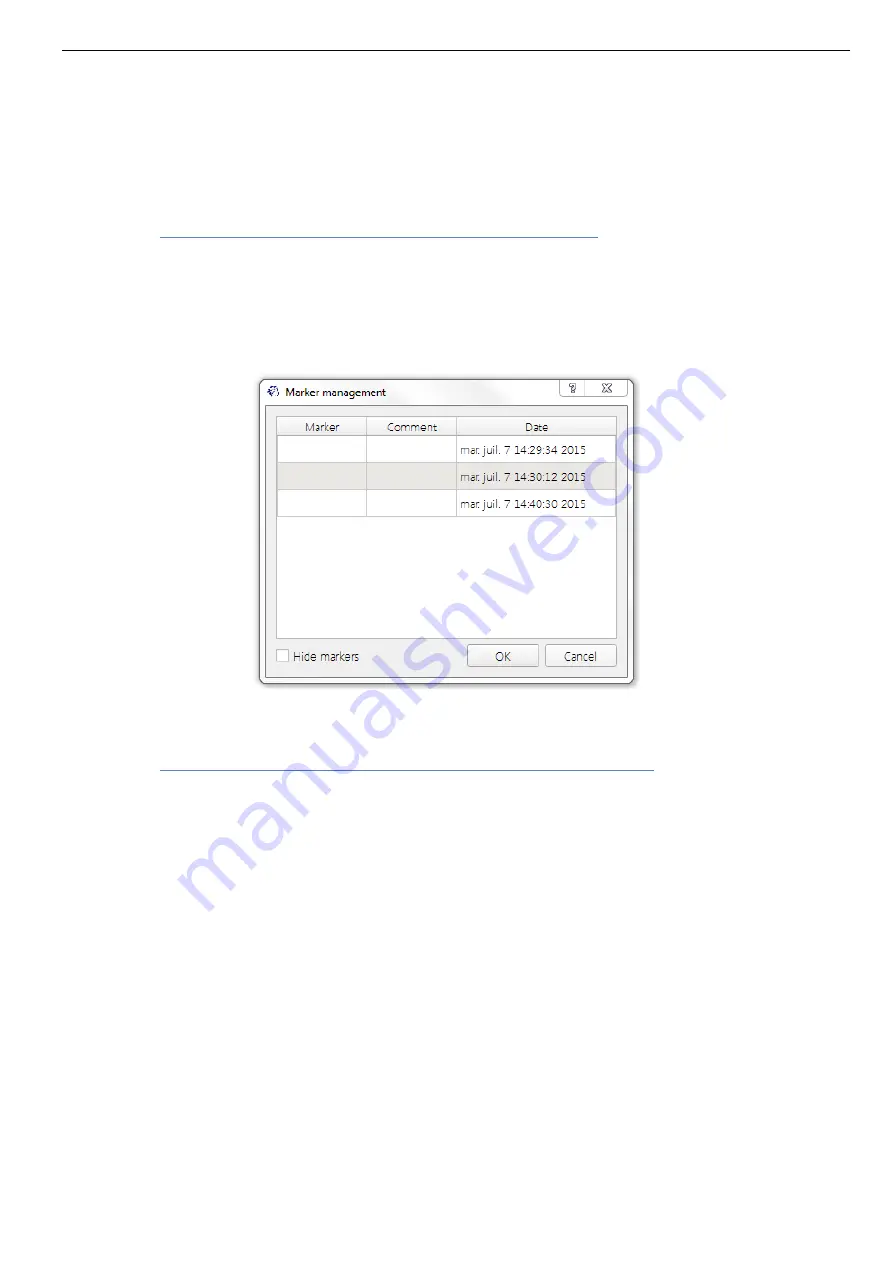
The data unload includes markers indicated during the registration period and displayed by a
vertical black line. These markers may be named by clicking on the box "Markers"; a window
appears to name them. For this purpose, just select the line for the desired marker, fill the
corresponding fields and confirm by clicking OK. They are displayed with corresponding
names.
Picture 27: Screen of marker management
7.1.3
Automatic markers on e-Performance manager software
Once an alarm is triggered on the monitor, an alarm marker is stored in the monitor. Then
these markers are visible on e-Performance Manager software by vertical red dashed lines.
The reason of the trigger is indicated at the bottom of the marker.
A green marker "
Replace mode
" appears at the beginning of the replace phase. The data
before this marker are all synchronized and may have a dating inaccuracy. This is a case
where the synchronization starts on a monitor without data (e.g. when using Backup mode).
When the function
“
min/max reset
” is performed, a corresponding marker is stored in the
graph.
A marker “
Low battery
” will be stored when the monitor begins to be in lack of battery during
data collection. It is at this time that the LED flashes and the screen switches off.
A marker “
monitor Shutdown
” appears when the monitor is completely out of battery.
A marker “
Frequency Configuration
” appears when period of measurement is changed.


