724-746-5500 | blackbox.com
Page 112
Chapter 9: Monitoring the WRT4000 Router
Below the graph, labels (with colors corresponding to areas in the graph) provide a key for information.
a. To see information for the past hour, day, week, month, and year for another WRT4000 Series Cellular Wireless Router in the
network, do the following:
i In the device name field (under the page heading Statistics in Figure 9-11), use the pulldown menu to select the router whose
statistics you wish to review.
ii Then select Display Host.
iii Use the time period’s pulldown menu to select 1hour, 1day, 1week, 1month, or 1year.
iv Then click on the button to Display Timespan.
• Statistics are displayed for the selected timespan.
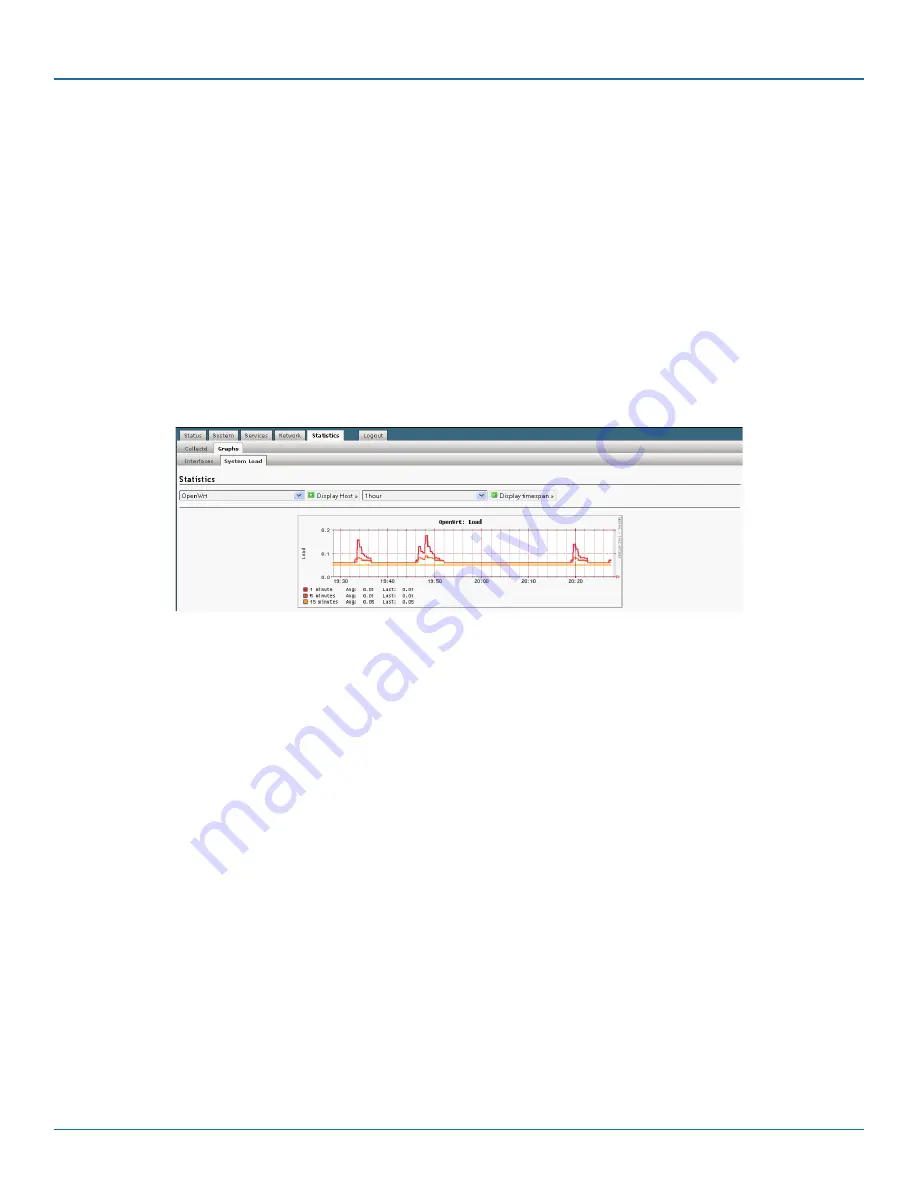
3. To see traffic statistics for all ports on the WRT4000 Series Cellular Wireless Router, select the System Load detail tab.
• The Graph for WRT4000 Series Cellular Wireless Router System Load Statistics is displayed (Figure 9-12).
Figure 9-12. Graph for WRT4000 Series Cellular Wireless Router System Load Statistics.
This screen shows the traffic load through all the ports of the WRT4000 Series Cellular Wireless Router.
Below the graph, labels (with colors corresponding to areas in the graph) provide a key for information.
a. To see information for the past hour, day, week, month, and year for another WRT4000 Series Cellular Wireless Router in the
network, do the following:
i In the device name field (under the page heading Statistics), use the pulldown menu to select the router whose statistics you
wish to review.
ii Then select Display Host.
iii Use the time period’s pulldown menu to select 1hour, 1day, 1week, 1month, or 1year.
iv Then click on the button to Display Timespan.
• Statistics are displayed for the selected timespan.
9.1.1.2 Displaying Graphs Beginning at the Current Time
To view graphs of WRT4000 Series Cellular Wireless Router traffic statistics beginning at the current second and continuing
through 3-second intervals, do the following on the WRT4000 Series Cellular Wireless Router management screens.
1. Select the Status management area.
2. Select the Realtime Graphs configuration area.
3. If necessary, select the Load detail tab.
• The WRT4000 Series Cellular Wireless Router Realtime Performance Graph is displayed (Figure 9-13).
Содержание WRT4000-ANT
Страница 141: ...724 746 5500 blackbox com Page 141 NOTES...
Страница 142: ...724 746 5500 blackbox com Page 142 NOTES...
Страница 143: ...724 746 5500 blackbox com Page 143 NOTES...


