


47
CHAPTER 3: Using the Local Terminal for Unit Setup and Management
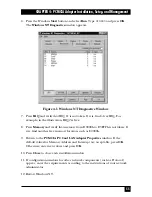
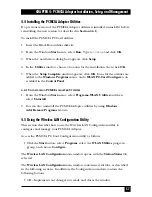
Figure 3-7. Receive Statistics.
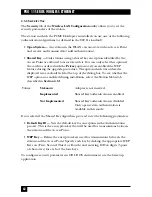
7. The RSSI is given in arbitrary units. Use the following graph to correlate RSSI
to dBm.
Figure 3-8. RSSI to dBm Graph.
8. Re-align the antennas until the maximum received signal strength is attained.
As you align the antennas, the RSSI (received signal strength indicator)
continually increases until it reaches a certain level, after which it begins to
decrease. That highest point is the maximum attainable RSSI level, indicating
optimum receive antenna alignment.
9. Switch the functions of either side of the link (set the transmit unit to receive
and the receive unit to transmit) and repeat the procedure to check the link
from the opposite direction.
RSSI vs. dBm
RSS
I V
alue
RF Level [dBm]
130
120
110
100
90
80
70
60
50
– 30
–40
–45
–50
–55
–60
–65
–70
–75
–78
–81
–83
–85
# Pack Ant RSSI1 RSSI2 Bit_Err Freqs Rate Quality
105
1
92
84
0
76
2
#########..
106
1
92
82
0
75
2
#########..
107
1
89
89
0
58
2
########...
108
1
95
92
0
51
2
##########.
109
1
95
89
0
46
2
##########.
110
1
95
81
0
10
2
##########.
111
1
95
90
0
31
2
##########.
112
1
95
51
0
4
2
##########.
113
1
92
85
0
5
2
#########..
114
1
99
90
0
77
2
##########.
115
1
102
89
0
43
2
###########
116
1
95
89
0
22
2
##########.
117
1
105
86
0
58
2
###########
118
1
103
89
0
51
2
###########
119
1
102
89
0
46
2
###########
120
1
104
69
0
64
2
###########
121
1
97
87
0
78
2
##########.
122
1
100
87
0
33
2
###########
123
2
87
85
0
71
2
########...
124
2
82
85
0
70
2
########...
Содержание LW0050A
Страница 2: ......


