36
Settings
(
SetY
)
—
sets the minimum and maximum value of the Y axis.
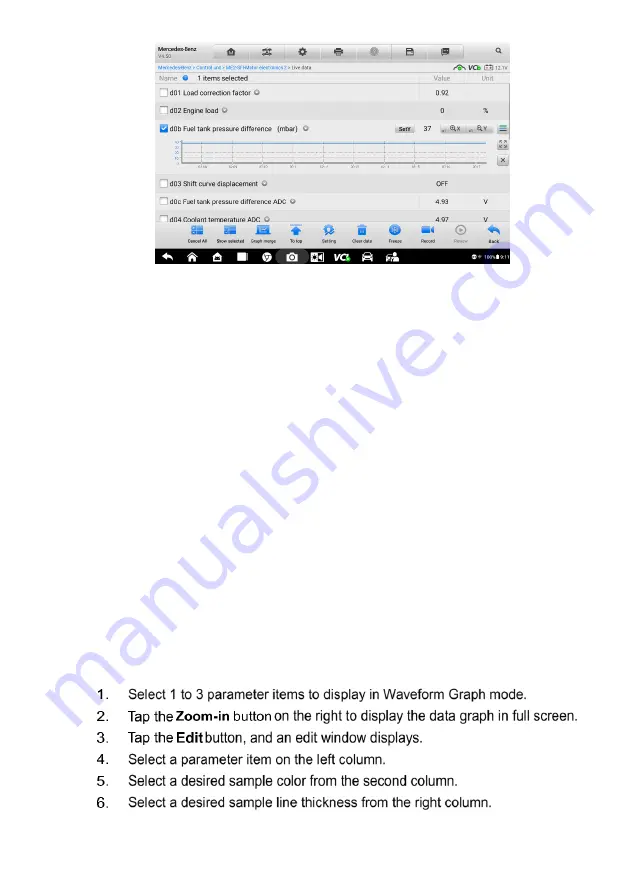
Edit
—
edits the waveform color and the line thickness.
Scale
—
changes the scale values, which are displayed below the
waveform graph. There are 4 scales available: x1, x2, x4 and x8.
Zoom-in
—
displays the selected data graph in full screen.
Exit
—
exits the waveform graph mode.
Full Screen Display
—
this option is only available in the waveform graph mode,
and mostly used in Graph Merge status for data comparison. There are three control
buttons available on the top-right side of the screen under this mode.
Edit
—
opens an edit window, in which you can set the waveform color and
the line thickness displayed for the selected parameter item.
Scale
—
changes the scale values, which are displayed below the
waveform graph. There are 4 scales available: x1, x2, x4 and x8.
Zoom-out
—
exits full screen display.
Exit
—
exits the waveform graph mode.
To edit the waveform color and line thickness in a data graph
Figure 4-12 Sample Waveform Graph Mode
Содержание OTOFIX D1 Pro
Страница 9: ...2 1 1 5 Procedures An arrow icon indicates a procedure Example To use the camera ...
Страница 66: ...59 Figure 7 5 Sample Vehicle Information Figure 7 4 Screen OBD Connect Screen ...
Страница 90: ...83 Refer to the associated TeamViewer documents for additional information ...
Страница 96: ...89 To search by functions Figure 16 2 Sample Function Viewer Screen 2 ...
Страница 102: ...95 ...
Страница 110: ...103 20 3CE Compliance RED Directive 2014 53 EU ...


