


32
Atmel AVR8015
32185A-AVR-01/12
6. At the end, you will get a summary with details about each sensor and
recommended settings.
7. You can either write these recommended settings to the kit or project file.
8. Save the design and project file and reopen them again to see if the changes
have been made.
4.8 Task 8: Log and analyze data
Logging the data.
1. If the Auto-start Reading option is checked, then Atmel QTouch Studio will
automatically start reading touch data when a kit is connected.
2. If unchecked, you must click the Start Reading button to make QTouch Studio
start reading touch data. Checking the Log data to file checkbox will make
QTouch Studio log data read from the kit.
3. As soon as reading has stopped, either because the user has clicked on the Stop
Reading button or the kit has been disconnected from the PC, a dialog will popup
to let the user specify a location and file name to save the logged data.
4. Note that clicking the Cancel button will simply discard all data logged and close
the dialog.
Analysis and debugging.
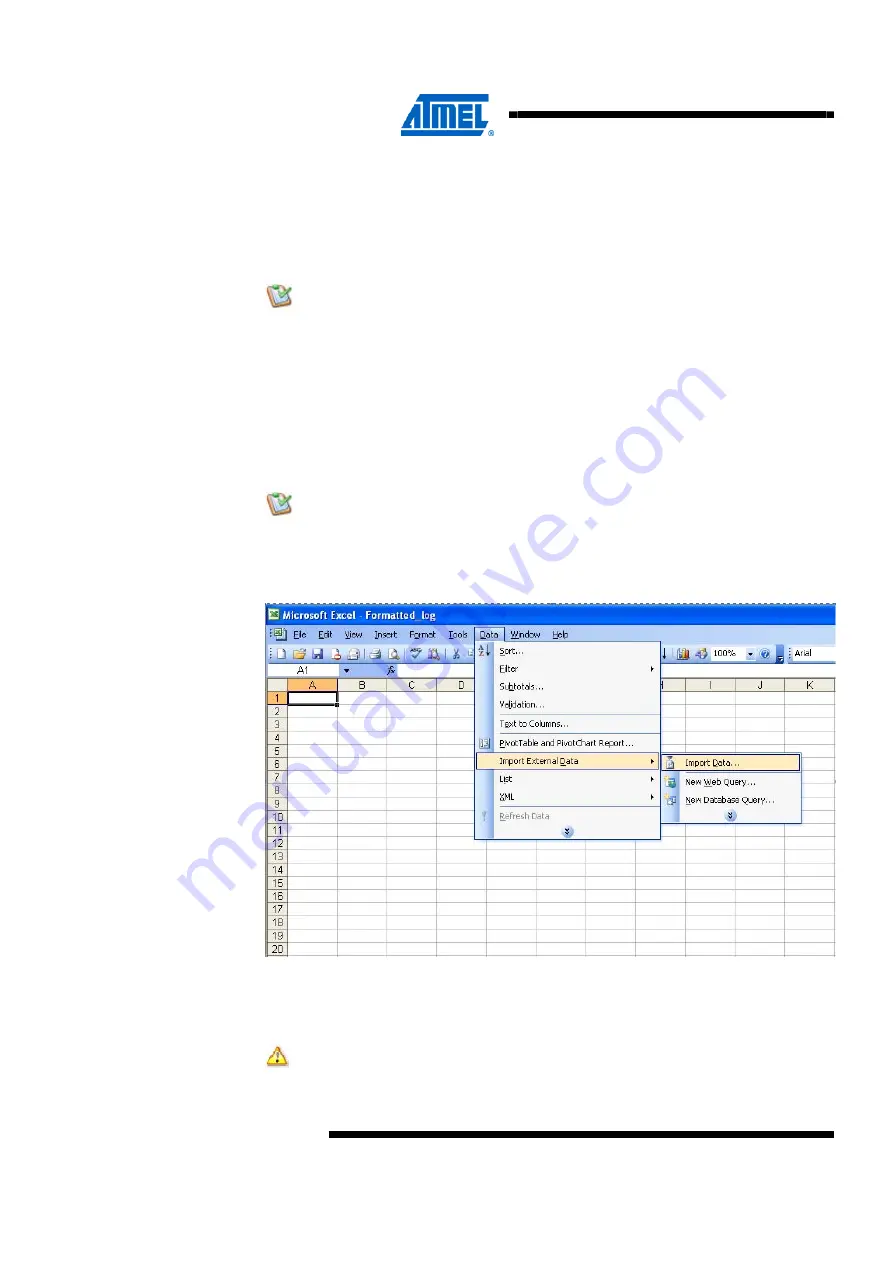
1. Open a new Excel spreadsheet and import data from the logged data.
2. Select tab and semicolon as delimiters and save the file.
Figure 4-33.
Importing data.
3. You can also create charts, which help in analyzing the logged data and
observing variations. In the Excel spreadsheet named Formatted_Log_Chart, you
can observe the delta variations for sensor 7 in the form of a chart as depicted.
Ensure the size of the logged data is less than 65535 as the Excel
spreadsheet can accommodate up to 65535 data values on each column.


