


Adjusting the Display Range
Data Explorer
™
Software User’s Guide
2-11
2
2.2 Adjusting the Display Range
To set the display range:
1.
Click the Chromatogram or Spectrum window to
activate it.
2.
From the Display menu, select Range.
3.
Select X Range to set the x-axis range. The scaling units
depend on the window you are scaling:
• Chromatogram—Scales in the same units
currently displayed in the Chromatogram
window (Spectrum Number or Time [Mariner
data only])
• Spectrum—Scales in m/z units
4.
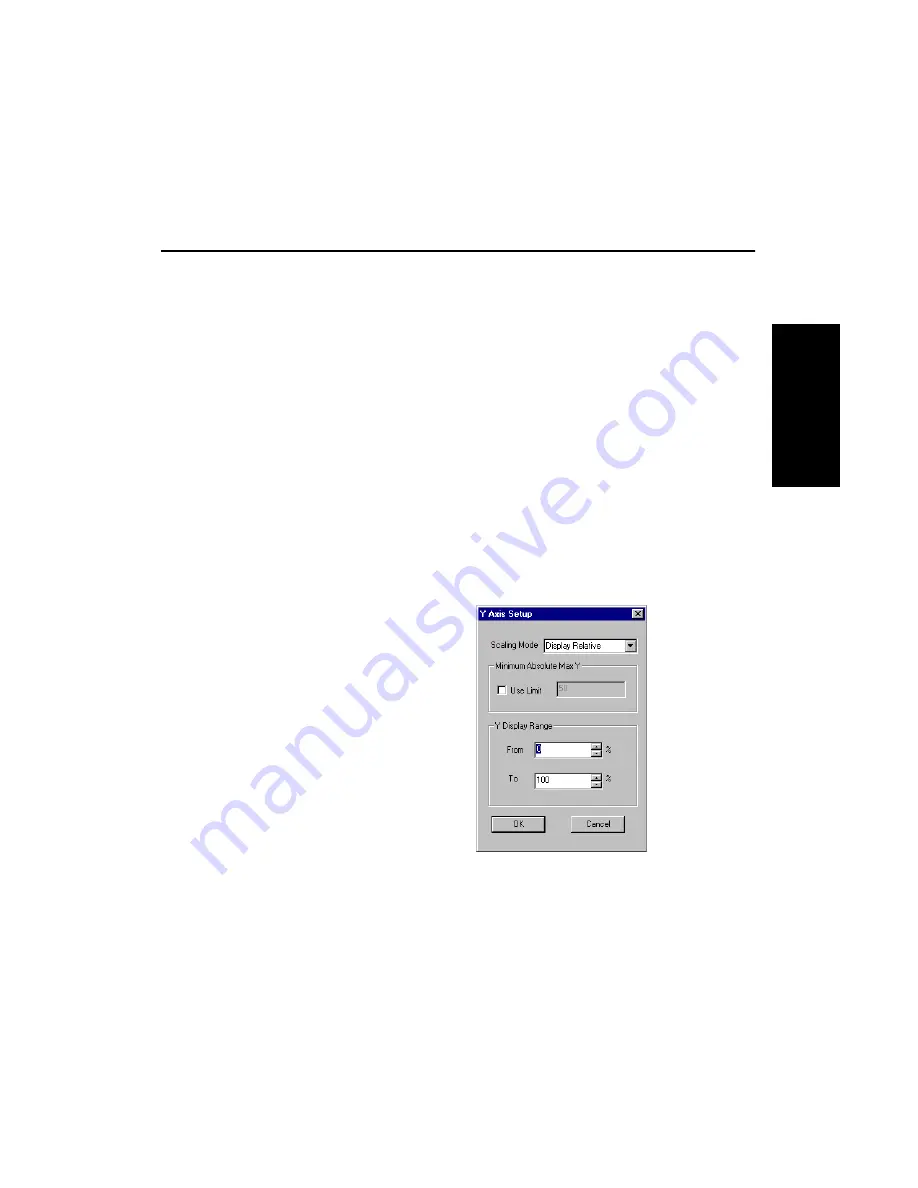
Select Y Range to scale the y-axis range.
The Y Axis Setup dialog box (Figure 2-6) is displayed.
Figure 2-6 Y Axis Setup Dialog Box
Содержание Data Explorer 4 Series
Страница 1: ...Data Explorer Software Version 4 Series Software User Guide ...
Страница 10: ...Table of Contents x Applied Biosystems ...
Страница 56: ...Chapter 1 Data Explorer Basics 1 42 Applied Biosystems 1 ...
Страница 98: ...Chapter 2 Using Chromatogram and Spectrum Windows 2 42 Applied Biosystems 2 ...
Страница 172: ...Chapter 3 Peak Detection and Labeling 3 74 Applied Biosystems 3 ...
Страница 204: ...Chapter 4 Examining Chromatogram Data 4 32 Applied Biosystems 4 ...
Страница 270: ...Chapter 5 Examining Spectrum Data 5 66 Applied Biosystems 5 ...
Страница 316: ...Chapter 6 Using Tools and Applications 6 46 Applied Biosystems 6 ...
Страница 384: ...Chapter 9 Troubleshooting 9 22 Applied Biosystems 9 ...
Страница 388: ...Appendix A Warranty A 4 Applied Biosystems A ...
Страница 416: ...Appendix C Data Explorer Toolbox Visual Basic Macros C 20 Applied Biosystems C ...
Страница 446: ...I D E X N Index 30 Applied Biosystems ...


