


Chapter 4 Examining Chromatogram Data
4-24
Applied Biosystems
4
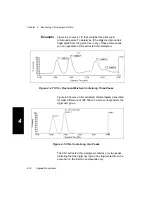
Hint: Add mode is useful when you filter the same trace for
different event tags. The original trace remains displayed
and accessible. Each filtered trace (up to four total traces)
is added, allowing for visual comparison.
Filtering
event tags
To display chromatogram traces for selected event tags:
1.
Display the data file containing the event tags.
2.
Click the Chromatogram window to activate it.
3.
From the Display menu, select Traces, then select the
trace type to filter.
4.
If you have more than one trace displayed, select the
trace to filter.
5.
From the Process menu, select Event Tag Filtering.
NOTE: If the Chromatogram window is not active,
Event Tag Filtering is not displayed on the Process
menu. If the active chromatogram was not collected
with an MS Method that specified event tags, the Event
Tag Filtering command is dimmed.
The Event Tag dialog box is displayed (Figure 4-10).
Figure 4-10 Event Tag Dialog Box
Содержание Data Explorer 4 Series
Страница 1: ...Data Explorer Software Version 4 Series Software User Guide ...
Страница 10: ...Table of Contents x Applied Biosystems ...
Страница 56: ...Chapter 1 Data Explorer Basics 1 42 Applied Biosystems 1 ...
Страница 98: ...Chapter 2 Using Chromatogram and Spectrum Windows 2 42 Applied Biosystems 2 ...
Страница 172: ...Chapter 3 Peak Detection and Labeling 3 74 Applied Biosystems 3 ...
Страница 204: ...Chapter 4 Examining Chromatogram Data 4 32 Applied Biosystems 4 ...
Страница 270: ...Chapter 5 Examining Spectrum Data 5 66 Applied Biosystems 5 ...
Страница 316: ...Chapter 6 Using Tools and Applications 6 46 Applied Biosystems 6 ...
Страница 384: ...Chapter 9 Troubleshooting 9 22 Applied Biosystems 9 ...
Страница 388: ...Appendix A Warranty A 4 Applied Biosystems A ...
Страница 416: ...Appendix C Data Explorer Toolbox Visual Basic Macros C 20 Applied Biosystems C ...
Страница 446: ...I D E X N Index 30 Applied Biosystems ...


