


Chapter 5 Examining Spectrum Data
5-36
Applied Biosystems
5
5.5 Centroiding
NOTE: Centroiding is not supported for Mariner DAD data.
To display peaks as centroid traces:
1.
Click the Spectrum window to activate it.
2.
Select Duplicate Active Trace from the Display menu to
keep the original data displayed after processing.
3.
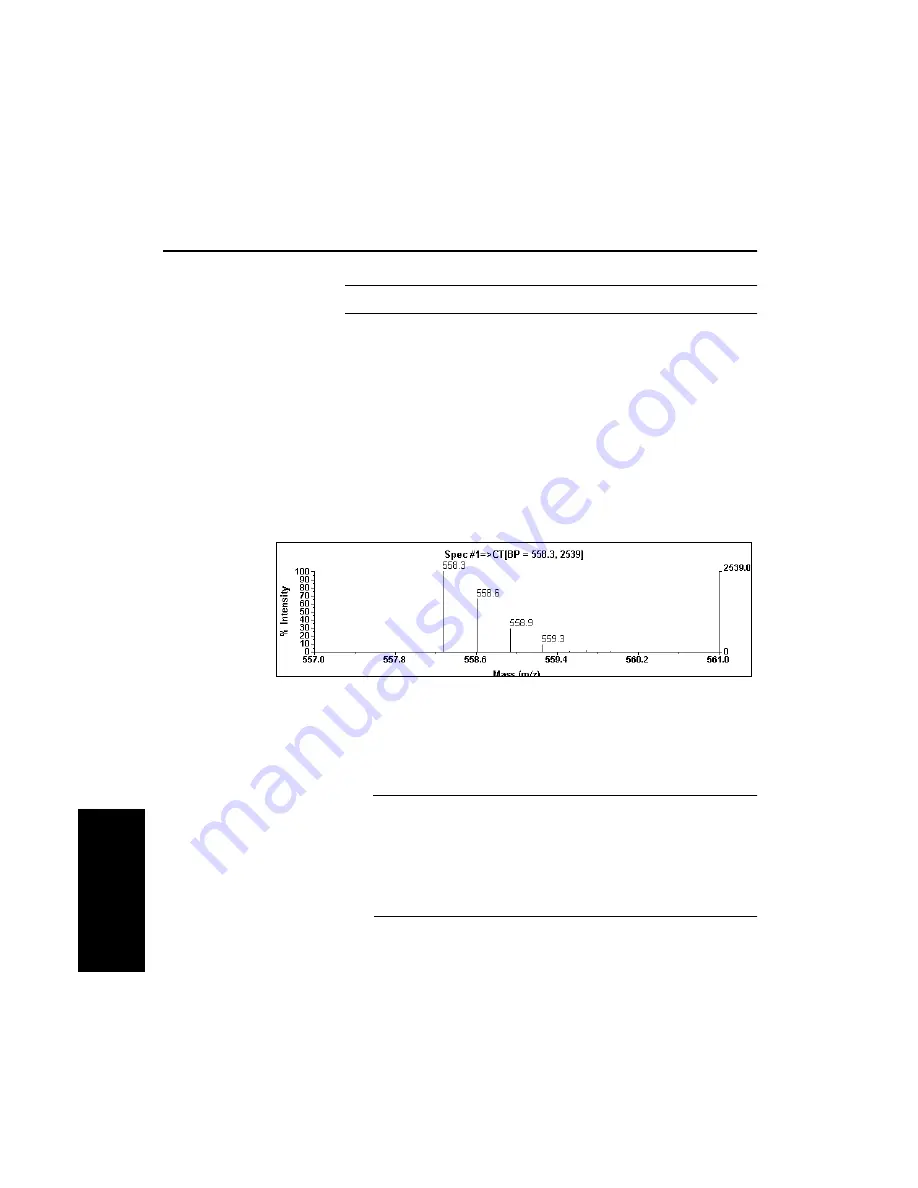
From the Process menu, select Centroiding.
The centroid spectrum is displayed with a CT trace
label (see Figure 5-10). The height of each vertical bar
corresponds to the original peak area.
Figure 5-10 Centroid Spectrum
4.
To return to the original trace, see “Returning to the
original spectrum” on page 5-3.
NOTE: If the original spectrum is displayed in vertical
bars instead of lines, select Graphic Options from the
Display menu, click the trace tab of interest, then select
Lines for the Line Type in the Plot Setup section of the
dialog box. For more information, see Section 1.5,
Setting Graphic Options.
Содержание Data Explorer 4 Series
Страница 1: ...Data Explorer Software Version 4 Series Software User Guide ...
Страница 10: ...Table of Contents x Applied Biosystems ...
Страница 56: ...Chapter 1 Data Explorer Basics 1 42 Applied Biosystems 1 ...
Страница 98: ...Chapter 2 Using Chromatogram and Spectrum Windows 2 42 Applied Biosystems 2 ...
Страница 172: ...Chapter 3 Peak Detection and Labeling 3 74 Applied Biosystems 3 ...
Страница 204: ...Chapter 4 Examining Chromatogram Data 4 32 Applied Biosystems 4 ...
Страница 270: ...Chapter 5 Examining Spectrum Data 5 66 Applied Biosystems 5 ...
Страница 316: ...Chapter 6 Using Tools and Applications 6 46 Applied Biosystems 6 ...
Страница 384: ...Chapter 9 Troubleshooting 9 22 Applied Biosystems 9 ...
Страница 388: ...Appendix A Warranty A 4 Applied Biosystems A ...
Страница 416: ...Appendix C Data Explorer Toolbox Visual Basic Macros C 20 Applied Biosystems C ...
Страница 446: ...I D E X N Index 30 Applied Biosystems ...


