17
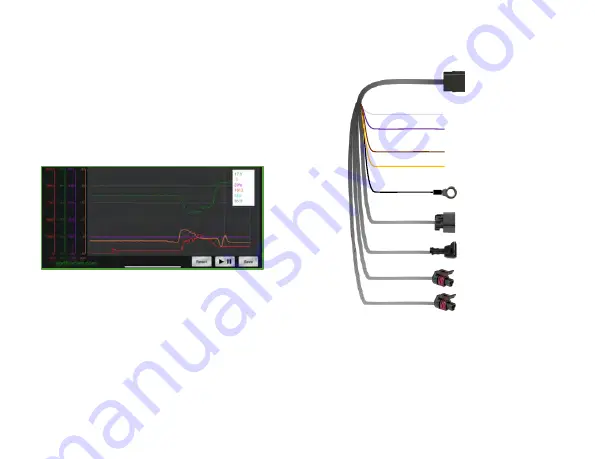
Data-Logging Screen
Rotating your device to the right will show the data logging screen. You
can only get to the datat logging screen from the main dashboard, so if
you are on the boost controller tab and want to see datalogging, you have
to go back to the main dashboard tab and then rotate your phone
clockwise. You can select any point on the graph, and it will show you
the values at that point. You can pause, and zoom in and pan to a section,
and hitting save will copy a screenshot to your photos. The data-logging
has a limited buffer, so you should hit pause if you want to look at a
specific event that just happened.
Note: Even though the are not dispalyed on the graph you can still get the ethanol level
and fuel temp from the datalog by tapping the screen anywhere and a box showing all the
values at that point will appear.
10
Wiring Harness
Below is the definition for each of the connectors on the supplied wiring
harness.
Yellow Wire: Switched
12V input power
Green Wire: Gauge 2
input (0V-5V)
Orange Wire: Gauge 1
input (0V-5V)
White Wire: DC Output (0-5V)
Purple Wire: E85 Raw Sensor
Output (integrated Pull-Up Resistor)
Brown Wire: Tach Input
Boost Solenoid
Flex Sensor
Connector
Ground
Connection
Flex Boost Module
Connection
Содержание Flex Boost
Страница 2: ...1 26...
Страница 27: ...1 26...


