


38
Agilent 86038B Photonic Dispersion and Loss Analyzer, Second Edition
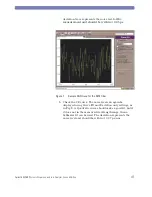
Figure 4
Sample PDL trace Top: for standard correction, Bottom: for
Option 400
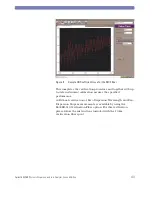
c Check the GD curve. Since the normalization and
measurement are made with the same connection, the
relative GD should ideally be 0 ps and a measurement
curve should look similar to Fig. 5. The variation from a
linear fit to the data is a measure of the noise and
Содержание 86038B
Страница 1: ...Agilent 86038B Photonic Dispersion and Loss Analyzer User s Guide ...
Страница 4: ...4 ...
Страница 20: ...20 Agilent 86038B Photonic Dispersion and Loss Analyzer Second Edition ...
Страница 34: ...34 Agilent 86038B Photonic Dispersion and Loss Analyzer Second Edition Figure 2 b Rear Panel ...
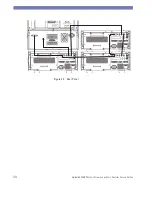
Страница 58: ...58 Agilent 86038B Photonic Dispersion and Loss Analyzer Second Edition Figure 11 86038B Block Diagram ...
Страница 78: ...78 Agilent 86038B Photonic Dispersion and Loss Analyzer Second Edition ...
Страница 92: ...92 Agilent 86038B Photonic Dispersion and Loss Analyzer Second Edition ...
Страница 202: ...202 Agilent 86038B Photonic Dispersion and Loss Analyzer Second Edition End Sub ...
Страница 230: ...230 Agilent 86038B Photonic Dispersion and Loss Analyzer Second Edition VB 6 0 Syntax pdlaClient Actions PrintScreen ...
Страница 348: ...348 Agilent 86038B Photonic Dispersion and Loss Analyzer Second Edition ...
Страница 349: ......


