


Viewing summary values
5.1.2.
Tooltip_summary_in_trend_2.jpg
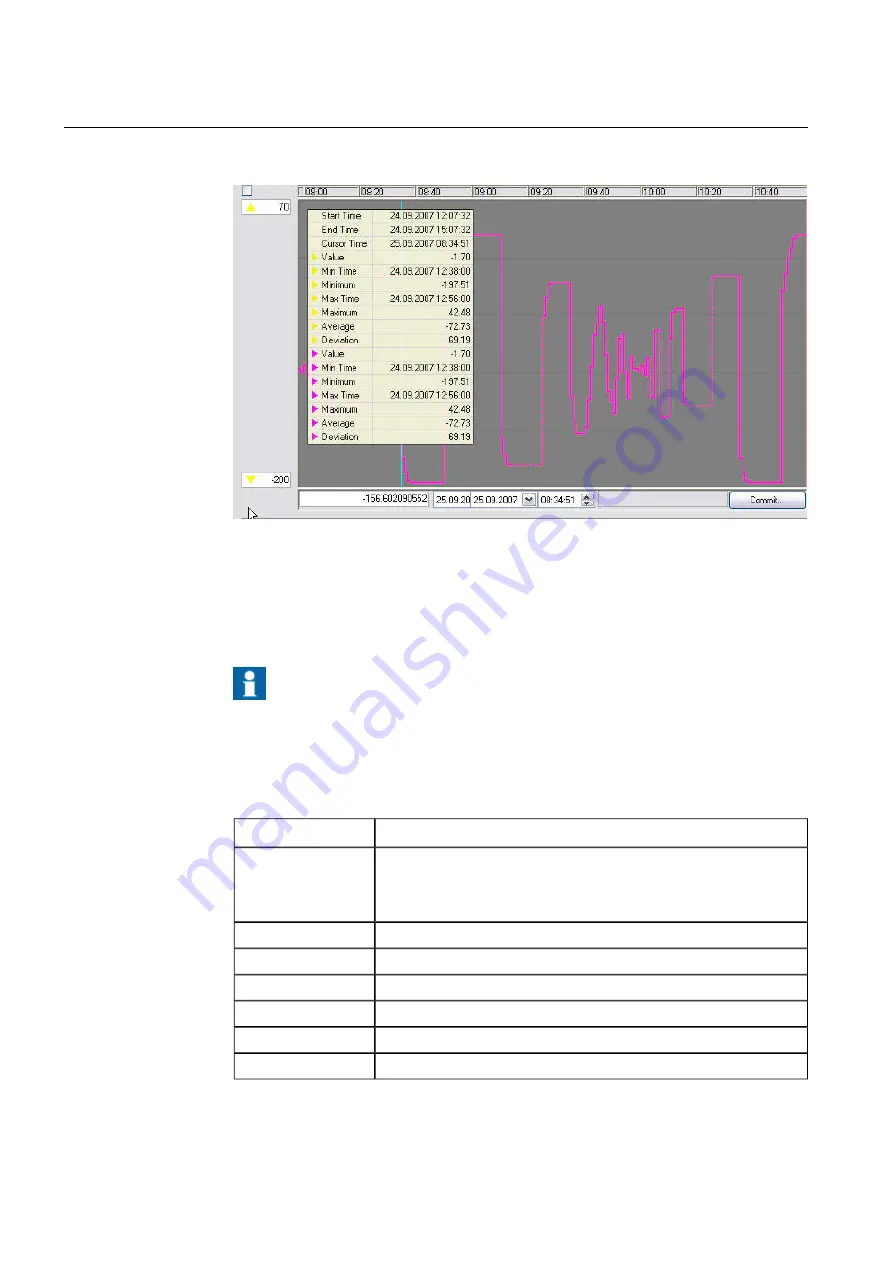
Figure 5.1.2-1 Tool tip summary in trend
Click the mouse at the desired location in the plot area. A turquoise vertical trend value
line is displayed in the location of the pointer. Its location is fixed in relation to the plots
and it moves with the plots when they are refreshed.
Cursor time and value rows are refreshed automatically by
clicking the mouse. For example Start time, End time, and
Minimum, however, are caught from the data when the display
is called or when the data is refetched by command. Thus they
are not automatically refreshed.
Table 5.1.2-1 Summary items
Description
Item
Right-click in the plot area and select
Summary
from the popup menu.
The window shown opens. It shows plot values at the trend value line
for all plots on the screen, as well as the minimum, average, maximum,
and deviation values calculated from the plot points.
Summary
Start time from the display call.
Start time
End time from the display call.
End time
Time corresponding to the desired location.
Cursor time
Value corresponding to the desired location.
Value
Minimum during the time span between the start and end time.
Minimum
Maximum during the time span between the start and end time.
Maximum
50
1MRS756739
COM600 series, Version 5.0
Data Historian Operator's Manual
Содержание COM600 series
Страница 1: ... COM600 series Version 5 0 Data Historian Operator s Manual ...
Страница 2: ......
Страница 6: ...6 ...
Страница 132: ...132 ...
Страница 136: ...136 ...
Страница 137: ......
Страница 138: ......
Страница 139: ......


