background image

38  


Auto-Run


  Date setting 


Models SE and DL 

Auto-Run 

SoundPro SE/DL has four automatic run modes which include:  Date auto-

start with duration, Day of the Week auto-start with duration, Timed Run 

(duration only setting), and Level Triggered Runs  (or Level auto-start runs). 

Setting up auto-run  

All Auto-Run setups begin in the Auto-Run screen. The Auto-Run screen 

shows the current status of the Auto-Run feature. The following features are 

available:   Disabled, Timed Run, DOW (day of week), Date, and Level-

Triggered settings. 

Date setting 

A Date mode run wakes up the instrument from a powered down condition, 

runs the study, saves it, then powers down again and is only executable 

once.  The parameters are selectable by specified dates and times with up to 

four programmable individual setups. 


A plus sign preceding a number (i.e., +1) indicates if one of the four settings 

is enabled (or activated) where as a negative sign (i.e. -4) represents a 

disabled (or deactivated) setting.  


  Setting up or changing auto-run with date parameter 

1.  From the start screen, press Up/Down           to highlight 

Setup

 and press 

Enter

       .   


2.  Select 

Auto-Run

 by using 

Up/Down

          to highlight and press 

Enter 


to select.   


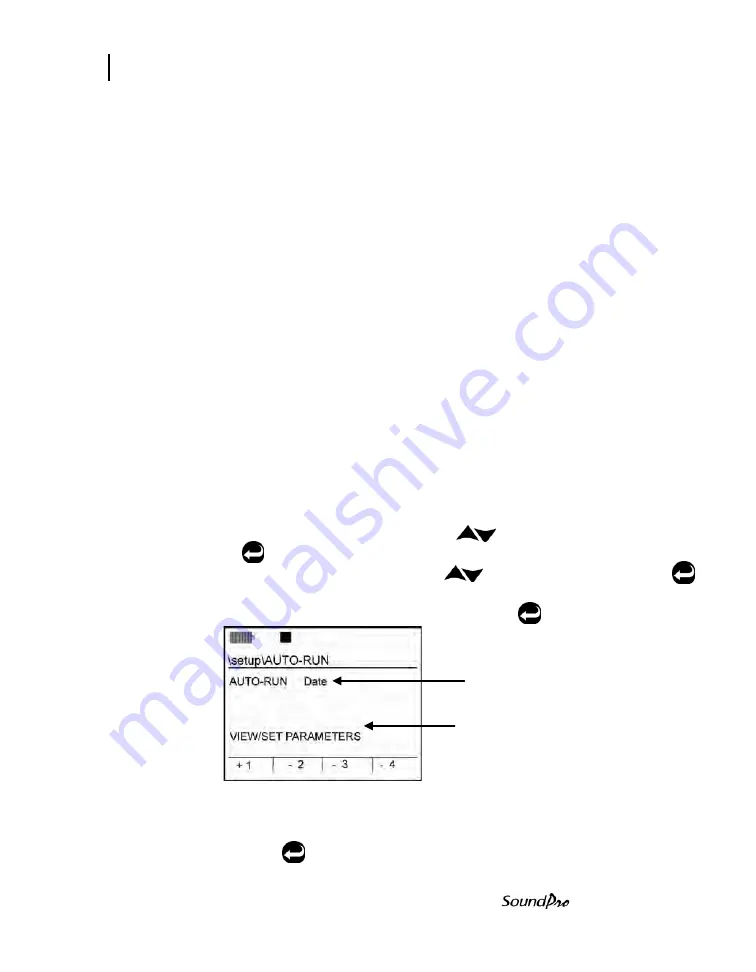
3.  In the Auto-Run screen, repeatedly press 

Enter 

      until 

Date

 appears.       


Figure 4-1:  Auto-Run with Date selected 

4.   To select 

View/Set Parameters

, press the 

Down

 arrow to highlight and 

press 

Enter      

Date setting 

View/Set Parameters – when 

selected a new menu appears   

Содержание SP-DL-1

Страница 1: ...3M Personal Safety Division 3MTM SoundPro SE DL SeriesSound Level Meters SoundProUser Manual ...

Страница 2: ... Do not store in temperatures exceeding 60 C 140 F Do not immerse in liquids Condensation may damage your instrument Substitution of components may impair the accuracy of the instrument Repair should be performed by authorized service personnel only Caution General The battery in this instrument has limited shelf life even if never used A non condensing environment is required for proper measureme...

Страница 3: ... The Display 5 Hardware interfaces 6 Memory card slot 6 USB port 6 AC DC port 7 Power jack 7 Auxiliary port 7 Information screen 8 Screen contents 8 Detection Management Software DMS 9 DMS Start Page 9 Getting Started 11 Checking the equipment 11 Installing the preamp 12 Microphone and accessories 12 Class Type 1 and Class Type 2 instrument 13 Windscreen 13 Providing power 14 Installing Batteries ...

Страница 4: ...off 21 Basic setups 23 Changing microphone settings 24 Time and date 25 Measurement type SLM 1 1 1 3 STI PA RT60 26 Meter 1 Meter 2 Parameters i e response time weighting 27 Measurement setup for community noise 28 C A measurement settings 30 Logging 31 Logging options 31 Exceedance level 31 Filters 31 Logging interval 31 Setting logging options 32 Setting up display options 33 Language 34 Backlig...

Страница 5: ...e Run 46 About Secure Setup 46 Disabling secure run or secure setup unlocking 49 Secure code backup number 49 Digital outputs Triggering 50 Tracking runs 50 Digital outputs and SPL 51 Communications 51 QSP Serial 52 Mass Storage 52 Viewing real time measurements remotely 53 GPS 54 GPS display 54 GPS explained 54 Preparing to measure running 57 Virtual meters 57 Meter 1 Meter 2 explained 57 Measure...

Страница 6: ...hting 66 Measurement screen icons 67 Descriptor types 67 Measurement screens 68 Bar Chart and Filtered Bar Chart 68 Community Noise screen 69 Dosimetry screen 70 Dosimetry measurements 70 Tabulation screens 71 1 1 and 1 3 octave analysis measurement results 71 Time History Back erase screen 72 Back erasing 72 Results of back erasing 73 Stopping a session 75 Stopping and pausing 75 RT60 Curves and ...

Страница 7: ...red curve applications 87 Setting up captured curves 88 Running captured curves 90 Criterion curve families 91 Types of Criterion Curves 91 Setting up criterion curves 92 Audiometric background curves 94 Setting up audiometric background curves 94 Running and viewing curves 96 Curve measurements and results 96 Speech Intelligibility 98 STI PA testing 98 Zones 98 Selecting STI scale or CIS scale 98...

Страница 8: ...d 112 Viewing past sessions studies review mode 112 Loading and deleting files 115 Session directory 116 Navigating in a session config directory 117 Naming and renaming files 117 Configuration directory 118 Saving naming setup file config file 118 Viewing loading deleting setup files config 119 Memory card 120 Compatibility 120 Formatting a card with the SoundPro 120 Communicating 121 Communicati...

Страница 9: ...er removable 127 Meters 127 Bandwidth 127 Octave filters optional 128 Third octave filters optional 128 Instrument noise 128 Environmental effects 128 Temperature 128 Humidity 129 User interface 129 Display 129 Keypad 129 Languages 129 Input output 129 Microphones 129 AC DC outputs 130 Communications ports 131 Measurements 131 Types 131 Ranges 131 Measurement parameters 131 Other 132 Calibration 1...

Страница 10: ...eries 14 Figure 2 5 Battery check screen 15 Figure 2 6 Selecting Setup in the Start Screen 16 Figure 2 7 Selecting battery type in battery check screen 16 Figure 2 8 Attaching the charger adapter with the plug adapter 17 Figure 2 9 Base or bottom of SoundPro 17 Figure 2 10 SoundPro SE DL start screen and keypad 18 Figure 3 1 Microphone Settings Signal Input screen 24 Figure 3 2 Time and Date Setti...

Страница 11: ...rt screen in run mode 64 Figure 5 7 Selecting measurements with Lookup softkey 66 Figure 5 8 Example measurement icons descriptors 67 Figure 5 9 Bar Chart screen and Filtered Bar Chart screen 68 Figure 5 10 Community Noise screen 69 Figure 5 11 Dosimetry screen 70 Figure 5 12 Tabulation screen for octave filtering 71 Figure 5 13 Back erasing 72 Figure 5 14 Time Log screen 74 Figure 5 15 Stopping a...

Страница 12: ...igure 7 8 Examples of directory screens 116 Figure 7 9 Naming a file in the Data File screen 117 Figure 7 10 Saving Creating setup file config file 118 Figure 7 11 Viewing loading deleting setup files 119 Figure A 1 Pinout for the AC DC output jack 135 Figure A 2L Auxiliary connector 135 TABLES Table 1 1 Acoustical range bands 4 Table 2 1 Keypad explained 19 Table 2 2 Screen Indicators 20 Table 3 ...

Страница 13: ...xii Table of Contents Models SE and DL This page left blank intentionally ...

Страница 14: ...ave RTA X X X SP SE 2 1 3 SoundPro SE 1 1 1 3 Octave RTA X SP SE 1 SoundPro SE Sound Level Meter X X SP SE 1 1 1 SoundPro SE 1 1 Octave RTA X X X SP SE 1 1 3 SoundPro SE 1 1 1 3 Octave RTA X X X X SP DL 2 SoundPro DL Datalogging SLM X X X SP DL 2 1 1 SoundPro DL 1 1 Octave Datalogging RTA X SP DL 2 1 3 SoundPro DL 1 1 1 3 Octave Datalogging RTA X X X X X SP DL 1 SoundPro DL Datalogging SLM X X X S...

Страница 15: ...a sound from other sounds for instance to detect the source of a sound or to measure how much particular sounds contribute to the overall sound level we may want to look at the frequency components of the sound Octave bands The ability of an instrument to separate a signal into its frequency components is known as a spectral analysis In sound pressure measurement the audio spectrum is divided into...

Страница 16: ... the next third octave band above the 1000 Hz third octave band is at 1260 Hz Figure 1 3 is similar to Figure 1 2 but shows the thirty three third octave bands in relation to the instrument s bandwidth Figure 1 3 Third Octave bands Naming bands Bands are conventionally named for their center frequencies in accordance with acoustical industry standards Table 1 1 identifies the SoundPro SE or DL mod...

Страница 17: ...1 5 39 811 40 50 119 50 63 096 63 63 79 433 80 100 00 100 125 89 125 125 158 49 160 199 53 200 251 19 250 250 316 23 315 398 11 400 501 19 500 500 630 96 630 794 33 800 1000 0 1000 1000 1258 9 1250 1584 9 1600 1995 3 2000 2000 2511 9 2500 3162 3 3150 3981 1 4000 4000 5011 9 5000 6309 6 6300 7943 3 8000 8000 10000 10000 12589 12500 15849 16000 16000 19953 20000 Table 1 1 Acoustical range bands ...

Страница 18: ...7 most measurements are reported for data obtained over the entire course of a study or session In some circumstances however you may want to save intermediate measurement results The SoundPro DL logging option provides you with that capability With logging enabled you can save selected measurements at fixed intervals during a session You can set logging to occur as often as once per second or as ...

Страница 19: ...ped with each SoundPro SE DL instrument The card should always be in place when you are operating the instrument More information about operating with the memory card is given under Memory card on page 106 NOTE You must use a compatible SD card For information about replacing the SD card see Compatibility on page 117 USB port A USB cable is shipped with each SoundPro SE DL instrument One end fits ...

Страница 20: ...echnical specifications see Power sources in Appendix A Part numbers are given under Optional parts in Appendix A Auxiliary port Use this port to connect the SoundPro SE DL instrument to other devices The two types of functions described below are available through the terminals of this port A pinout of the port is provided under Auxiliary connector on page 139 Digital I O A group of contacts with...

Страница 21: ...howing in order the 3M designation SE or DL the Class Type 1 or 2 and the filter if installed 1 1 1 3 or blank Line 2 Unique serial number assigned when the instrument was manufactured Line 3 The installed feature s field lists any extra options note these may be additionally purchased features as displayed above for Curves and STI PA NOTE It s a good idea to record Information screen data in the ...

Страница 22: ...onals Retrieve download share and save instrument data Generate insightful charts and reports Export and share recorded data Perform What If analysis and recalculate data based on selected time intervals Set up instruments and check for firmware updates Some data can only be displayed in DMS One example is logging data obtained when logging is enabled in an instrument equipped with that option Log...

Страница 23: ...10 Detection Management Software DMS DMS Start Page Models SE and DL This page left intentionally blank ...

Страница 24: ...e equipment If your instrument was sent to you in a storage case you will want to remove all the packaging and acquaint yourself with the equipment so you can quickly get started The items below are included in a standard SoundPro SE or DL kit Figure 2 1 Identify SoundPro equipment CHAPTER 2 SoundPro Preamp Windscreen Microphone Optional 1 and microphones available USB cable QSP II software Option...

Страница 25: ...e to secure the preamp to the instrument It will fit snuggly Connecting an extension cable Extension cables are available from 3M as options and are typically used to distance the instrument body from the microphone to reduce distorting reflections from the instrument s case 1 Attach the cable to the base as if it were the preamp and then follow the steps above Connecting to the instrument Attach ...

Страница 26: ...t device All other Class Type 1 microphones Remove the microphone from its protective case and thread it on the preamp Before using be sure to remove the plastic cap and save it in the case for future use Class Type 2 microphones Remove the microphone from its protective case and thread it on the preamp Before using be sure to remove plastic cap and save it in the case for future use NOTE to prope...

Страница 27: ...ng the recharging device available from 3M or a compatible device available elsewhere Selecting batteries Do not mix battery types or batteries with significantly different charge levels NOTE To avoid possible battery leakage remove the batteries when the meter is not in use for prolonged periods To install batteries 1 With the back of the instrument facing up push the release latch to pop open th...

Страница 28: ...e see next section external power sources the external power will take precedence over batteries if installed Figure 2 5 Battery check screen Checking or changing type The battery type selection in this display affects the accuracy of the Battery Indicator that appears in many SoundPro SE DL displays NOTE It is recommended to match the battery type to the type of batteries installed in the instrum...

Страница 29: ...light Setup and then press Enter 3 In the Setup screen select Battery then press Enter The Battery Check screen appears Figure 2 7 Selecting battery type in battery check screen 4 Press the softkey that corresponds with the installed battery type See A or B in Figure 2 7 for selection The label above the softkey is underlined to indicate the current selection 5 When completed press On Off Esc once...

Страница 30: ...g adapter It slides into place by guiding it down the back cavity opening of the power supply NOTE the example is a typical adapter which may be different than the one you are using Mechanically it will function similarly Figure 2 8 Attaching the charger adapter with the plug adapter Connecting power supply source 1 Ensure the power supply is assembled for universal power supply only 2 Plug the po...

Страница 31: ... essential main screen is also used to navigate through the menu options The keypad and softkeys are used to setup the instrument run a study stop a study view your measurement values and power on and off the meter Figure 2 10 SoundPro SE DL start screen and keypad 1 Display 8 Softkeys 12 ON Off and ESC 2 Backlight 9 AltF 6 Run Pause Indicators Battery power Stop Run time 00 00 00 SLM CAL FILE COM...

Страница 32: ...ata 6 Run Pause Used to Run or Pause a study A run or pause indicator will appear at the top of the screen to signal you of the appropriate mode 7 Softkey menu The softkey menu are additional menu options for setting measurement type i e SLM 1 1 etc Calibrating Loading a study file setting Lock secure settings and many more options 8 Softkeys The Softkey buttons correspond with the softkey menu Pl...

Страница 33: ...his icon appears when the current session is open but paused Stop state This icon appears when the current session is stopped Review mode When the pause and stop icons appear this indicates that you are viewing a saved file Overload condition When an overload occurs during a study this indicator appears and remains lit until the beginning of the next study Underrange condition When an underrange c...

Страница 34: ...e On Off Esc button is also used as a navigational tool at any time you wish to move back one level If you press ESC repeatedly you will return to the start screen Turning off 1 To turn off the SoundPro ensure the meter is stopped i e indicator will display on the top of the screen 2 Press and hold the On Off ESC button until the start screen disappears ...

Страница 35: ...22 Turning off Navigating Models SE and DL This page left blank intentionally ...

Страница 36: ...Meter 2 parameters Setting up Exceedance levels Setting up Logging Setting physical settings backlight on time contrast choosing a language Microphone settings With Class Type 1 models the microphone s sensitivity range cap and polarization can be checked and or changed in the Signal Input menu when stopped Alternatively Class Type 2 models settings are viewable at any time the session is stopped ...

Страница 37: ...icrophone Settings Signal Input screen 4 Signal Input options are explained below refer to Figure 3 1 above A Sensitivity Calibration parameter for the selected microphone This is a nominal value in decibels relevant to 1V Pa B Range Cap Top of the measurement range for the microphone instrument combination In any screen showing a decibel range this setting affects the maximum value C Polarization...

Страница 38: ...y pressing On Off Esc If turned on ensure you are at the start screen by pressing On Off esc repeatedly until you return to start screen see Figure 2 10 2 Press Up Down to highlight Setup and then press Enter 3 In the Setup screen select Time Date then press Enter 4 In the Time Date screen press to select either the Time Date Day fields Then do one of the following a For Time field press Enter rep...

Страница 39: ...s stopped as indicated by the stop icon Depending on the options you ordered with your SoundPro it may or may not have all the measurement types indicated above NOTE For STI PA and RT60 please see Chapter 6 Additional Options Setting Measurement type 1 Turn on the SoundPro SE DL by pressing On Off Esc If turned on and you are not at the start screen press On Off Esc repeatedly until the start scre...

Страница 40: ...the either Fast F Slow S or Impulse I is selected An underline denotes which feature is selected 5 To set the weighting for Meter 1 press the third softkey repeatedly until either A C Z of F is underlined or selected To set Meter 2 response time and weighting press 4th softkey until Meter 2 is selected Then repeat steps 4 5 6 To change the Meter parameters press Up Down to select one of the Meter ...

Страница 41: ... to the start screen see Figure 3 3 2 Press Up Down to highlight Setup and then press Enter 3 Select Measures from the Setup screen by pressing Up Down to highlight and then press Enter 4 In the Measures screen press Up Down to select one of the measurements To select second column first press Up Down arrows then press Right arrow Figure 3 5 Measures screen for community noise settings 5 To make c...

Страница 42: ... value of your choice 1 99 LDN Representing the Day Night sound level this measurement is 24 hour average sound level where 10 dB is added to all of the readings that occur between 10pm to 7am Please see glossary of terms for more details Optional Settings Set to Off or On CNEL Community Noise Exposure Level The accumulated exposure to sound measured in 24 hour sampling interval and artificially b...

Страница 43: ...ace before you visit the Measures screen Thresholds Both meters set to Off or the same value Exchange rates Both meters set to the same value Time response Both meters set to the same value Frequency weightings Meter 1 must be set to A weighting Meter 2 must be set to C weighting Figure 3 6 is an example of the appropriate C A settings for Meter 1 left side and Meter 2 right side Please see Meter ...

Страница 44: ...pectively See Chapter 5 Preparing to measure and running Exceedance level Up to two different exceedance level percentages ranging from 1 99 can be set in the Meter 1 Logging screen when the logging interval is set to 1 minute NOTE if the logging interval field is not set to 1 minute N A not available will appear in the data field Filters The filter option is either a On or Off setting in Meter 1 ...

Страница 45: ...ns for Meter 1 do the following a Press Up Down to highlight either AVG PEAK MAX MIN b Once the measurement is selected press Enter button to toggle between On or Off Press right left arrow to move back to logging field NOTE If you are setting Meter 2 options ensure you are on Meter 2 by pressing the Meter 1 Meter 2 softkey and then repeat step 4a b Figure 3 8 Logging screen explained 5 To change ...

Страница 46: ...n to highlight Filters and then press Enter to toggle between On or Off 8 To change the Logging Interval press Up Down to select Interval a Press Enter to move to the data field i e 1 minute To change the value repeatedly press Up Down until the appropriate minutes or seconds are displayed b Press right left arrow to move back to interval field 9 To return to the Start screen repeatedly press On O...

Страница 47: ... 2 Press Up Down to highlight Setup and then press Enter 3 Select Display by pressing Up Down to highlight and then press Enter 4 In the Display screen ensure Language is highlighted or press up down arrow to select and press Enter The Language screen appears An asterisk precedes the name of the currently selected language 5 Press Up Down to select a language an asterisk will appear if selected an...

Страница 48: ... life by up to 10 Setting or viewing Backlight options 1 From the start screen press Up Down to highlight Setup and press Enter 2 In the Setup screen press Up Down to highlight Display and press Enter 3 In the Display screen press Up Down to highlight Backlight 4 Press Enter to move to the data field Repeatedly press Enter to toggle between Manual and XX Sec fields NOTE if you are not setting the ...

Страница 49: ...ging the contrast on the display 1 From the start screen press Up Down to highlight Setup and press Enter 2 In the Setup screen press Up Down to highlight Display and press Enter 3 Press Up Down to highlight Contrast and then press Enter 4 Repeatedly press the left or right arrow to decrease or increase the contrast NOTE The contrast will change as you change the contrast color with the left or ri...

Страница 50: ... and stop sessions based on time date duration settings and level triggered run mode which is used to control runtimes of studies and sessions using internal and external signals Triggering Control the runtimes of studies and sessions using internal and external signals Security Prevent certain uses of the instrument by someone who doesn t know the security codes available for all instruments Logg...

Страница 51: ...study saves it then powers down again and is only executable once The parameters are selectable by specified dates and times with up to four programmable individual setups A plus sign preceding a number i e 1 indicates if one of the four settings is enabled or activated where as a negative sign i e 4 represents a disabled or deactivated setting Setting up or changing auto run with date parameter 1...

Страница 52: ...me and Duration D Time it is important to note that the settings are formatted as Hours Minutes Seconds and based on a 24 hour clock In Figure 4 3 the Start time is indicated as 16 30 00 which is equivalent to 4 30pm To Set press Up Down arrows to increase decrease values To move between each increment press Enter 8 To set additional Auto Runs repeatedly press Enter until Auto Run is highlighted T...

Страница 53: ...ent is in the off position The meter will then automatically switch into Auto Run based on your setup Figure 4 3 Example of setting up Auto Run QSP II A study run under the DOW mode wakes up the instrument from a powered down condition runs the study saves it then powers the instrument down again The cycle repeats for the next time and day in the setup and for the other Auto on 2 if that is also a...

Страница 54: ...me and duration values Press Enter to toggle through the fields or press left right arrows 7 Skip this step if not setting auto run 2 To set auto run 2 press softkey 2 until the screen displays a plus symbol in front of 2 This denotes it is activated Then repeat steps 5 6 8 To exit the screen press On Off Esc repeatedly until you return to the main screen Press and hold the On Off Esc to power off...

Страница 55: ...creen explained The Auto Run Shutdown screen is a map of your auto run settings It identifies the mode the activated setups in that mode AR and the order in which the setups will occur If Auto Run is enabled in the Date mode and more than two setups are activated only the first two will be shown because of limited screen space If you power on the instrument after the first auto run has been saved ...

Страница 56: ... press Enter 2 Select Auto Run by using Up Down to highlight and press Enter to select 3 In the Auto Run screen repeatedly press Enter until Timed Run appears 4 To set the duration press Enter to toggle between the Hours Minutes and Seconds field To change the time values press Up Down repeatedly until the specified value is selected 5 Press On Off Esc repeatedly to return to the start screen When...

Страница 57: ...planation of settings Figure 4 7 Level Triggered screen Level Triggered Explanation of Settings A Mode The mode or Filtered Mode can be set to Level On Off and Windowed settings In Level On Off mode the unit starts a run when the source level exceeds the specified criteria and stops pauses when level falls below the off criteria The on criteria is met and either pause or stop a run when the off cr...

Страница 58: ...f selecting one of the 4 captured curves to trigger a run To select a captured curve set the Source as Curve and then change the Level field to one of the following CAP 1 CAP 2 CAP 3 or CAP 4 EXT External Trigger feature is triggered by the digital input on the curve indicator To select external trigger select EXT as the source field and select LO for the level field TIMED When selected as the RUN...

Страница 59: ...de NOTE Security settings survive a shutdown Setting secure run or secure setup locking Run Security and Setup Security are both enabled and disabled in the Lock screen For Secure Run you can be in pause or stop mode when locking For Secure Setup you must be in stop mode to set and enable this feature About Secure Run When you enable Run Mode Security and start a run the Secure Run Mode screen app...

Страница 60: ... the Lock screen there are two selectable fields Secure Run Mode with a status line Secure Setup Mode with a status line Each Status Line is used to specify either a disabled state or an enabled state when a code is entered to assign an unlock code Figure 4 9 Secure Lock screen Setting Lock feature Enable or Disable Secure Run Mode Enable or Disable Secure Setup Mode Lock Press 4 th softkey to sel...

Страница 61: ...lect a numeric code press Up Down arrows to select a number press Enter to toggle between the fields Press Enter to Enable Press On Off Esc key to return to the Start screen When you are ready to run a session press the Run Pause key and the Secure Run Mode prompt will appear See Disabling secure run or secure setup below for details on stopping the run Figure 4 11 Secure lock run prompt Selected ...

Страница 62: ...ble Setup Mode security only when the session is stopped From Secure Run or Secure Setup screen 1 Both screens will have a Lock softkey see Figures 4 11 or 4 12 2 Press the Lock softkey and the code will appear see Figure 4 10 for example 3 Enter in the code using Up Down arrows to change value and Enter to move to next field 4 Press Enter to exit the code field Disabled will appear indicating the...

Страница 63: ...to highlight Setup and press Enter 2 Select Digital Out by using Up Down to highlight and press Enter to select 3 Press to select Output 1 4 Press to enable Run Pse or disable Off run tracking 5 If you enabled and want to reverse the trigger logic continue below Otherwise skip to step 9 6 Press to select Logic 123 then press to enter the first data field The second data field is for Output 1 7 Pre...

Страница 64: ...nt 5 Press to exit the data field 6 If satisfied with the trigger logic skip to the last step of this procedure To toggle the logic setting continue below 7 Press to select Logic 123 then press to enter the first data field The third and fourth data fields are for Output 1 and Output 2 respectively 8 Press to select the appropriate data field 9 Press to toggle the logic state The displayed logic s...

Страница 65: ...Much the same way a small pocket USB flash drive operates When obtaining data from the SoundPro via Mass Storage it is important to remember that the data obtained is in Native SoundPro SES format It cannot be read with Excel Word etc A SoundPro SES to XML conversion utility is available NOTE When using Mass storage the user must use the Windows Safely Remove Hardware feature to un mount the Sound...

Страница 66: ...SB cable to the USB port Hardware interfaces on page 6 8 Connect the large end of the USB cable to a standard sized USB connector on the computer Viewing real time measurements remotely On the SoundPro the Log to Port feature provides the functionality to stream logged data out the serial port at the log rate to an external device such as a pc With this feature you are able to view logged measurem...

Страница 67: ...S NOTE GPS time can be viewed in the Comm Set screen but is not used in the instrument or added to session files Time and date stamping in session files uses information that is manually entered Time and date on page 25 or downloaded from QSP II Information screen on page 8 GPS display You can view GPS data in the Comm Set screen The position coordinates are stored in each study when GPS is enable...

Страница 68: ...ngland GMT and differs in hours from your time by the number of time zones between your location and Greenwich Enabling GPS communications 1 If a session is running stop it 2 Connect the RS 232 cable to the GPS receiver and to the auxiliary port of the SoundPro SE DL instrument Auxiliary port on page 7 3 Referring to the user manual for the GPS receiver prepare the device to receive satellite sign...

Страница 69: ...56 Communications GPS Models SE and DL This page left blank intentionally ...

Страница 70: ... Meter 1 is the primary meter Meter 2 is the secondary meter If a filter option is installed in the instrument the filtered measurements are associated with Meter 1 only Setting Meter 1 Meter 2 Parameters are explained in Chapter 3 See Figure 3 4 for a screen example Measurement notation IEC ISO Many of the instrument s measurements are labeled in accordance with nota tion standardized jointly by ...

Страница 71: ... instrument s sessions See Chapter 7 3 Adjust your settings to fit the specifications of your sound study See Chapter 4 and Chapter 6 4 Set the measurement range Chapter 5 5 Calibrate the SoundPro Chapter 5 6 Position the SoundPro in the field and connect appropriate external devices if applicable 7 Press the Run Pause key to start the session Chapter 5 8 To Pause the session if needed press the R...

Страница 72: ... entire session Likewise an average or an accumulation for a study is continued using data from subsequent studies in the session to arrive at the corresponding average or accumulation for the entire session Studies Studies are periods in a session during which measurements are acquired processed and saved by the instrument The duration of each study period is called the study s run time Session a...

Страница 73: ...creen may appear with a different measurement displayed and a different range This is dependent on the settings you may have selected For more information please see Measurement Type on page 26 2 Depending on if you selected basic SLM or applied 1 1 or 1 3 octave band filters a bar chart screen or a filtered bar chart screen will appear press This changes the range and the change is confirmed in t...

Страница 74: ...0 Calibration screen The Calibration screen contains a calibration option called Calibrate and a Calibration History The history shows Pre Calibration Pre Cal and Post Calibration Post Cal results for previous calibrations as applicable For each calibration type the resulting SPL level is shown along with the time and the date of the calibration Pre Calibration The main reason to calibrate is to a...

Страница 75: ...ant to insert the cal adapter into the mouth of the calibrator If the SoundPro has a windscreen please remove Calibrating 1 Ensure the SoundPro is turned On and is either stopped or paused 2 Attach the calibrator and cal adapter to the SoundPro Set the calibrator to 1 KHz and 114 dB if it is a selectable Figure 5 2 Attaching calibrator to SoundPro 3 From the Start screen press the Cal softkey and ...

Страница 76: ...8 Press On Off Esc key to exit the Cal screen 9 For a Post Calibration ensure the SoundPro is in Pause mode Essentially run a measurement and press the run pause key The Pause indicator will appear at the top of the display Then repeat the Calibration steps above and press Enter to store the Post Calibration information A sample screen is displayed below with post calibration history Measurement v...

Страница 77: ... saved as you continue to run and pause your measurements Once stopped this will save as one session Running a session study 1 From the Start screen select either View Session or select View Current Study 2 To select press arrows and then press 3 Press to begin measuring A session is currently open for the instrument when either the Run icon or the Pause icon appears in the Status Area at the top ...

Страница 78: ...f your instrument contains a filter option and is set to an octave or third octave analysis type the screen that appears next in order after the Bar Chart is a Tabular screen There may be one or more additional Tabular screens depending upon the analysis type that s in effect Dosimetry screen Available for both meters all viewing areas and all instrument types Community screen Available only for M...

Страница 79: ...s Alternate Functions key to show the softkey labels 2 Press the softkey to display the Selection Panel The available measurements are arranged in a column with the selected measurement marked Figure 5 7 Selecting measurements with Lookup softkey 3 Press to make a different selection 4 With your selection marked press or press to make the change effective NOTE When viewing during broadband analysi...

Страница 80: ...he Broadband chart figure below displays an example of these icons and descriptors Figure 5 8 Example measurement icons descriptors Descriptor types Viewing Descriptors Explanations SS Session identification This field tells you the name of the session that you re viewing either the current one or the one you loaded before entering the viewing area SY Study identification This field which appears ...

Страница 81: ...r chart The chart shows measurements in each filter band and broadband values for both meters That means that for octave analysis the screen contains 13 bars 11 for filters and 2 for broadband and for third octave analysis the screen contains 35 bars 33 for filters and 2 for broadband A bars appears and usually fluctuate if the measured value for the bar is above the minimum value for the selected...

Страница 82: ...weighting Community Noise screen This screen shows the results of measurements commonly associated with community noise studies Results are only available in this screen for those measurements that are activated for the current session on meter 1 The screen components are explained in detail in the Measurement setup for Community Noise on pages 28 29 Figure 5 10 Community Noise screen NOTE Communi...

Страница 83: ...simetry screen Dosimetry measurements Dosimetry measurements depend upon the run time the longer the run time the greater the accumulated dose Accordingly dose measurements will either remain the same or grow during a study or session They are determined from broadband data regardless of the selected analysis type Dosimetry View Shows accumulated personal exposure to noise These measurements are a...

Страница 84: ...bulated values in this screen are for the displayed measurement and the selected meter Broadband measurements The first measurement in the screen is a broadband measurement for the selected meter Following that measurement is the number of the selected meter Meter 1 in this example Filtered measurements After the broadband measurement all other measurements given in the display are for Meter 1 in ...

Страница 85: ...Figure 5 13 Back erasing Back erasing You can remove undesirable data at the end of a study with a process called back erasing Back erasing is available only under these conditions Analysis type Back erasing is unavailable for filtered studies Viewing areas You must be in either the View Current Studies or View Session viewing area Back erasing is not available in View Past Studies Restricted to t...

Страница 86: ... the new run times and other changes that resulted from the back erasing Back erased raw data The raw data that you removed by back erasing is saved in the session s file You can post edit back erased data with DMS software How to back erase 1 While running a study view the Time Log screen in either the View Current Study or the View Session viewing area 2 If you see data that you would like to re...

Страница 87: ...ng 5 When you have the Time Line in position press The Time Line disappears and the softkey labels appear in the Softkey Region of the display 6 To cancel this screen press to begin the process again The Time Line will reappear and you can select a different segment to back erase NOTE At anytime you can leave the time log screen and return another time to edit the back erase segment provided that ...

Страница 88: ... Stopping and pausing A manual session stop is a little different from a study pause To pause a study you simply press the Run Pause key and the command is immediately executed To stop a session however you need to press and hold the Stop key If you don t press and hold the stop key for the 3 second countdown period the stop command is ignored and the session remains open If you hold throughout th...

Страница 89: ...76 Back erasing Stopping a session Models SE and DL This page left blank intentionally ...

Страница 90: ...enclosed space after the sound is removed or decayed How is reverberation or reverb created in enclosed spaces A sound is generated in an enclosed structure with a combination of the direct sound source which travels from the sound source to listener by the shortest path without interfering with room surfaces and the reflected indirect sound source The total sound source echoes and decays as the s...

Страница 91: ...or impulse sound methods The example below displays the Reverberation Time in an enclosed room How it is measured with the impulse method 1 A starter gun provides a broad impulsive spectrum noise at 110 dB The instrument automatically begins plotting the sound decay see dB level 1 and stops as the noise falls off see dB level 2 Hence the rate of decay is calculated from decay curve or regression l...

Страница 92: ...el source and falls off returning to its original ambient background level The Reverb Time is measured between T1 and T2 indicators with an ending RT60 time value NOTE T1 is calculated from two reference points on the regression line to ensure an accurate sound level capture Figure 6 2 Interrupted noise example Impulse noise The Impulse noise method requires a broad spectrum impulsive noise source...

Страница 93: ...band This results in either eight or twenty four session ensembles one for each frequency band in 1 1 Octave or 1 3 Octave modes respectively Threshold Specifies the dB level for triggering the start or run of the instrument The interpretation of this field is dependent on the measurement method Auto This is the default threshold setting The instrument will automatically chose the level and calcul...

Страница 94: ...ted or Impulse when Method is selected To change the Averaging field press to switch between Measurement or Ensemble when Averaging is selected To change the Threshold press Press to toggle between Auto or a dB level value To change the dB level press Arrows to a specific decibel level is selected i e 80 dB when Threshold is selected To change the Measure field press to toggle between Auto or an R...

Страница 95: ... to get an average measurement for the room Once the setup options are selected please follow the procedures below to run and view RT60 measurements Reverberation RT60 Test 1 Select setup parameters via the Reverb Time screen see Setting up Reverberation above 2 Skip this step if threshold is set to Auto View the ambient noise in the room the LZMAXvalue and note the value NOTE To ensure a decay cu...

Страница 96: ...rd the results NOTE You may want to repeat this process a few times to ensure the readings are accurate Once the RT60 is captured a pause indicator will appear at the top of the screen To run another study press the run key again and follow step 4 Or if you do not want to combine all of the run pauses into a session press Stop and then Proceed with the Run key and follow step 4 Reverberation resul...

Страница 97: ...hes instead of a value Figure 6 5 RT60 bar chart screen Deleting RT60 value in a filtered band This optional feature allows you to delete a selected filtered band from the session average and is available when in review mode of view current study screens This may be used if for example you had someone accidentally walk in during your test and begin speaking You could delete the bands which interfe...

Страница 98: ...rb Decay curve from the study i e one filter band or the average of all studies within that session For more information refer to Sessions and Studies in Chapter 5 Viewing decay value of each band 1 The decay value for each specific band is viewable by pressing the left right arrow keys Figure 6 6 Decay curve screen NOTE To delete a curve please see Deleting RT60 value in a filtered band above Ove...

Страница 99: ... the Up Down Arrow keys to page through the filters data results Column Explanation of data Freq The Frequency column displays the chosen filter bands for 1 1 Octave the range is 63Hz 8KHz and for 1 3 Octave the range is 50Hz 10KHz T60 T60 column displays the results of the decay curve in seconds R 2 R 2 column displays the reverberation time measurements The values represent a goodness to fit ran...

Страница 100: ...it may be used as an evaluation for product or process comparisons job task risk assessments environmental investigations and other applications Captured curve applications Application 1 Baseline Applying a captured curve as a baseline or reference curve for noise abatement investigation The operator captures the original noise and then makes various changes to the machine and or enclosure and loo...

Страница 101: ...re 3 4 page 27 for an example NOTE It is recommended to set Meter 1 to Slow response Z weighting and measurement to Leq 3 Press On Off Esc to return to the start screen 4 Select Setup use up down arrows to highlight and press Enter 5 Select Options menu use up down arrows to highlight and press Enter 6 Select Curves menu use up down arrows to highlight and press Enter 7 For the Mode press Enter re...

Страница 102: ...you choose Survey or Evaluation mode the captured curved results will report the same data The survey mode is recommended for Captured Curves since it is slightly easier to use in the field 8 Depending on your selection in step 4 refer to the following If Survey Mode was selected please see step 6 If Evaluation mode was selected press Up Down to highlight Criterion Repeatedly press Enter to select...

Страница 103: ...ss Up Down to select or highlight View Session and press Enter 3 In the View session screen select the appropriate meter 1 settings by using the corresponding softkeys for response time weighting and measurement type lookup key 4 Press Run to start your study Depending on if you chose survey mode see a below or evaluation mode see b below in the setup screen do one of the following a Survey mode w...

Страница 104: ...r option to display and record a selection of spectral curves for use in room and building acoustic measurements and noise control engineering The objective of a criterion curve is to specify the ambient noise in a room or environment with a single number or statement rather than individually specifying multiple octave or third octave band limits as you do with captured curves Types of Criterion C...

Страница 105: ...udies machine noise evaluations and for some community noise enforcement applications Setting up criterion curves Setting up criterion curves is similar to setting up captured curve parameters However with criterion curves you select a specific curve type and then it is applied during your study or test Setting up criterion curves and appropriate measurement type 1 From the start screen select eit...

Страница 106: ...mples to evaluate and re evaluate noise in a room zone Evaluation Mode evaluates the noise levels against specific criterion NOTE Whether you choose Survey or Evaluation mode the criterion curved results will report the same data 8 Select a type by pressing Up Down to move to the Type field 9 Repeatedly press Enter to toggle between the five criterion curve options NOTE Depending on the Criterion ...

Страница 107: ...1999 and allows for a variety of audiometric earphones using 1 1 and 1 3 octave band analysis Setting up audiometric background curves For set up parameters it is recommended to set Meter 1 to Slow Response Z Weighting and measurement to Leq before you run your study Additionally the measurement type should be set to 1 1 octave for OSHA audiometric testing and should be set to 1 1 or 1 3 octave fo...

Страница 108: ... response Setting Weighting Repeatedly press 3 rd softkey to select appropriate setting recommended is Z for Z weighting Figure 6 15 Selecting measurement type for curves 4 Press On Off Esc to return to the start screen 5 Select Setup use up down arrows to highlight and press Enter 6 Select Options menu use up down arrows to highlight and press Enter 7 Select Curves menu use up down arrows to high...

Страница 109: ...on Running and viewing a curve study Running and viewing curves After you have enabled curve mode type and criterion only applicable for evaluation mode you are now ready to run a curve study When viewing your measurements it is important to understand how your results will display The following is an explanation of the curve types If NC PNC NR NCB or RC are selected these will display in 1 1 octa...

Страница 110: ... on page 69 for a screen example d Dosimetry screen shows dosimetry measurements see e below e Delta screen displays difference between the selected curve and current measurement in each filter band A positive value is the amount exceeding the curve see e Delta screen and reference A in the figure and a negative value is the amount below the curve NOTE for a captured curve it will display CAP 1 or...

Страница 111: ... listener path is evaluated and a recommended measurement is computed at the end of an intelligibility test The following sections briefly address points to consider when setting up a STI PA test Zones Where do I measure speech intelligibility A building or stadium can be broken into zones Each zone has a room with one alarm system In some situations one room may have more than one alarm system or...

Страница 112: ...scale and run your study in the mapped zone areas Scenario two In other situations running a test tone through a PA system during business hours could be distracting and not feasible for your environment In this situation it is recommended to follow these procedures First take sample background noise measurements during business hours These are saved and stored on the Verifier as Captured Curves T...

Страница 113: ...post process your intelligibility measurements with previously captured background noise you would first capture curves and then apply this during your study 7 After a 15 second countdown either a STI or CIS level is displayed with a pass fail message 8 The technician sound tester moves throughout the building and measures in all zones rooms NOTE A zone room is typically a room 20x20 More than one...

Страница 114: ...cenario 2 for more details Range field You can change the range when measuring The following ranges are selectable parameters 90 dB 140 dB 80 dB 130 dB 70 dB 120 dB 60 dB 110 dB 50 dB 100 dB 40 dB 90 dB 30 dB 80 dB and 20 dB 70 dB Table 6 3 Measures setup screen parameters explained Setting up STI PA speech intelligibility 1 Turn the meter On 2 From the Start screen select the Measurement type as ...

Страница 115: ...ress Enter to select Male or Female 8 To change the Post Processing field press up down arrows to select the field and repeatedly press Enter to select a Captured Curve or Off 9 To change the Range press Down arrow and then repeatedly press Enter to select a specific range 10 Once set press Enter to return to the Start screen Speech Intelligibility screen Setup screen Captured Curve selection If y...

Страница 116: ...rve pop menu remove the noise or come back later when the noise is not present That is because impulsive noise and strong voices can skew the measurement results If you captured the background noise you would then come back when the noise is not present and apply the captured curve during a STI PA measurement See Applying captured curves for STI PA testing for more details on page 106 The followin...

Страница 117: ... screens The test signal is made up of 7 octave band signals which encompasses a combination of vowels and syllables from common speech There are 14 modulating frequencies that emulate a male female s speech patterns The STI method is based on the determination of the modulation transfer function MTF which is the ratio of measured modulation to the overall signal strength at each modulation freque...

Страница 118: ...age without any distortions or interference Figure 6 22 STI PA Modulation screen Table 6 4 defines the STI PA modulation frequencies for the seven octave bands per the IEC 60268 16 standard Table 6 5 defines the STI octave band with specific male and female weighting factors used with STI PA measurements per the IEC 60268 16 standard Octave band Hz 125 250 500 1 k 2 k 4 k 8 k First modulation freq...

Страница 119: ...ound noise capture curve In order to measure and store background noise prior to STI PA testing you will want to measure or capture the level via the Captured Curve Setup and then apply it during the STI PA test Note this is only performed if you do not want to play the test tone during normal business hours 1 From the Start screen select either 1 1 octave or 1 3 octave for the measurement type Fi...

Страница 120: ...formation please see Changing displayed measurements In the broadband RTA screen press Altf key This will expand the softkeys and Cap will appear When the level is stabilized press the Capture key See Figure 6 26 4 Optional To capture additional background levels change the 1 st softkey to either Cap 1 Cap 2 Cap 3 Cap 4 and then press the Capture 2 nd softkey Repeat this step as needed You can sto...

Страница 121: ...ew Session and press Press Altf key 2 Select one of the captured curves by pressing the 1st softkey i e Cap 1 Press On Off Esc key 3 From the Start screen press the 1st softkey continuously until STI PA is selected Then select View Session and the STI PA screen will open Figure 6 27 Post CAP 1 applied during STI PA test CAP 1 Press first softkey to assign a captured curve name i e CAP 1 CAP 2 CAP ...

Страница 122: ...n Stop key while playing the test signal in the appropriate location zone The captured curve will automatically calculate with the STI PA results NOTE press the left right arrow to view the modulation screen and or the modulation envelope screen if desired STI PA test results screen ...

Страница 123: ...110 Speech Intelligibility STI PA results screens Models SE and DL This page left blank intentionally ...

Страница 124: ...tudy will be reduced by the duration of the back erased segment Analysis type The analysis type selection if available in your instrument that applied when the measurements were made Calibrations If performed Pre Calibration results for the session and Post Calibration results for studies in the session Logged data Stored with the session if the instrument contains the logging option and logging w...

Страница 125: ...not be inserted or removed when working in the instrument s file system you can lose data File directory screen explained NOTE this is accessible when a session is not opened i e run pause mode 1 From the Start screen press the File softkey The File screen appears 2 In the File screen select Session Directory or Configuration Directory then press The directory that you requested appears Figure 7 1...

Страница 126: ...ults will be played back also called review mode in accordance with the analysis type that was selected when the measurements were stored 1 From the Start screen press the File softkey Figure 7 2 Start menu screen 2 Session Directory will be highlighted press Enter Figure 7 3 File menu screen File Session Directory Softkeys ...

Страница 127: ...ill state Loaded Press either Enter or On Off Esc key 5 In the Start screen the review indicator appears Select either View Session or View Current Study by pressing and Figure 7 5 Selecting past study data review mode Press Load softkey Data file View current study is selected Press enter to view data Review mode when both Pause and Stop indicators appear this signifies you can view your saved se...

Страница 128: ...s important to note that the delete operations take place as soon as you press the respective softkey While you can re load a file you cannot un delete a file so be careful Loading and deleting files is accessed via the File softkey Session Directory menu Loading or deleting a file 1 From the start screen press the File softkey 2 In the File menu ensure Session Directory is highlighted if it is no...

Страница 129: ...iles NOTE You may have dozens of files saved Press the More softkey to expand the file list for the appropriate selection 5 If you loaded a file please see next section Viewing past sessions studies Session directory The Session Directory contains the past saved sessions and studies To navigate to this screen select Setup File softkey Session Directory menu Refer to Figure 7 2 and Figure 7 3 for s...

Страница 130: ...naming the session in memory 1 In the Start screen press the File softkey The File screen appears 2 Press to select Re name Last Session File then press The session file renaming screen appears 3 In the File Name screen press and the following changes will occur The highlighted cursor moves to the field of one of the four softkeys depending upon the last character in the existing filename The last...

Страница 131: ... saving a setup you first select the settings and then save via the Save Config File accessed from the File softkey in the start menu Once a configuration is saved you can view or delete it via the Config Directory Naming and Saving set up 1 Ensure the SoundPro is in Stop mode and the parameters are selected See Chapter 3 and Chapter 4 for details 2 In the Start screen press the File softkey and s...

Страница 132: ...to cancel Viewing loading deleting setup files config Viewing loading deleting setup files 1 Open the Configuration Directory screen follow steps 1 2 above Saving setup file 2 The Setup File screen will appear Depending on what setups you saved these will appear in this screen 3 To Load or Delete a file configuration do the following Select a file you wish to load delete by pressing up down arrow ...

Страница 133: ...s they use 3M can only guarantee operation with cards available from 3M If using a memory card with 2GB or less FAT 16 format is required For cards ranging from 2GB to 32GB a FAT 32 format is required Determining the format of an SD card 1 Insert the card in the computer s card reader drive 2 Open Windows Explorer 3 Right click on the CD drive listed under My Computer 4 From the right click menu s...

Страница 134: ...e panel layout page Using an external card reader DMS can import data configurations with an external SD card reader You should never remove a card from a reader without first ejecting it from the drive Eject using the following Windows procedure Eject procedure 1 In the computer right click the Removable Disk entry under My Computer A menu appears 2 Click Eject in the right click menu Working wit...

Страница 135: ... finder in step A See C A 2 DMS Welcome page and instrument communication A Click on icon see A to access the Instrument download panel 4 Selecting and viewing data A The Data Finder page see A is used to view select and preview reports Note Click Browse to view all data files B Select the data by clicking on either the session study Note you may need to expand to see the study data C To view in G...

Страница 136: ... Output Vrms Full scale 3 16 10 dB 1 00 20 dB 0 316 30 dB 0 100 40 dB 0 0316 50 dB 0 0100 60 dB 0 00316 Table 8 1 AC output NOTE The AC output signal is not intended to be used for testing instrument performance DC output The DC output has a voltage range between 0 and 4 0 VDC that is produced by Meter 1 and includes the time response and frequency weighting settings for that meter It represents a...

Страница 137: ...AC DC output DC output 124 Models SE and DL This page left blank intentionally ...

Страница 138: ...nd Analog and Digital Filters ANSI S1 4 1983 R2001 American National Standard Specification for Sound Level Meters ANSI S1 43 1997 R2002 American National Standard Specifications for Integrating Averaging Sound Level Meters Earlier standards IEC 60651 and IEC 60804 EMC emissions and immunity Pending testing on production products References Air temperature 23 C Static pressure 101 325 kPa Relative...

Страница 139: ...s between the maximum overcharge voltage of the NiMH cells 6 6 volts and the low voltage automatic shut down voltage of 4 4 volts Power sources Internal power Approximately 8 hours of continuous operation at normal mode of operation under reference environmental conditions when full capacity batteries are installed Main batteries Four replaceable alkaline AA batteries included as original equipmen...

Страница 140: ...Volts is the nominal power supply voltage to be applied to the DC power jack Preamplifier removable Microphone Accepts 13 2 mm 0 52 microphone directly Other sizes require an adapter Input impedance Greater than 1 GΩ less than 2 pF Signal limit 11 VAC maximum Cable attachment Capable of driving up to a 15M cable with negligible signal loss Meters Dual meters Contains two separate meter circuits ea...

Страница 141: ...d The half power points are at 0 89 fc and 1 12 fc Third octave skirts With respect to fc the fc 2 and 2fc frequencies are both approximately 50 dB down Instrument noise Noise floor depends upon which microphone is being used The following measurements are for a typical instrument with the 059 703 adapter 18 pF connected to the preamp and shorted at the BNC end This condition closely simulates the...

Страница 142: ...e Digital SD data storage device that is inserted in a slot at the base of the instrument Stores measurements made in studies and sessions in session files If the instrument has a logging option installed and is logging measurements the logged values are stored in the applicable session file as well The card also stores configuration files Microphones The following specifications apply to micropho...

Страница 143: ...Free Field Free Field Free Field Free Field Free Field Pressure Frequency response 2 dB 8 Hz to 20 kHz 20 Hz to 17 kHz 20 Hz to 24 5 kHz 5 Hz to 24 5 kHz 5 Hz to 20 kHz 3 Hz to 10 kHz Sensitivity dBV 28 29 49 1 36 26 26 Sensitivity mV 40 35 3 5 15 8 50 50 dB noise 1 kHz third octave band 0 0 10 0 1 dBA noise 22 22 32 22 18 dBC noise 31 31 41 31 21 dBZ noise 35 35 45 35 25 dBF noise 40 40 50 40 33 ...

Страница 144: ...WA Taktmaximal TAKTMX Dose Projected Dose PDSE Exposure EXP Community noise dosimetry Exceedance Ln Day Night average Ldn Community Noise Exposure Level CNEL SPL difference for C and A time response settings Lc a Overload Time OL The percentage of time over the OL setting Ranges Broadband Eight selectable ranges of 90 dB each Filtered Eight selectable ranges of 80 dB each Measurement parameters Re...

Страница 145: ...s and sessions Run time clock Duration of every run and session shown in screens as well as added to the session file Manual operation Run Pause and Stop keys Programmed operation Three Auto Run modes Date four options Day of the week any time on any day Timed future start time Triggered runs Trigger on measured SPL or on external input Triggers can start a study then either pause in the session o...

Страница 146: ...ltered logging can be selected where filtered logging will depend upon the analysis type setting for the session Logging interval User selectable from among 11 settings ranging from 1 second to one hour Part numbers Replacement parts Part Number Description 053 840 SoundPro SE DL Class 1 BK4936 microphone kit BK4936 microphone 056 990 microphone to calibrator adapter and 059 344 windscreen 053 841...

Страница 147: ...ondenser type 058 488 QE4170 pressure microphone 1 condenser type 053 571 9V Switching type universal power supply 057 860 Detection Management Software 056 981 QC 10 Calibrator 114dB at 1000 Hz Output 056 982 QC 20 Calibrator Selectable 94dB or 114dB at 250 Hz or 1000 Hz Output Part Number Description 056 990 1 2 inch Microphone to calibrator adapter for QC 10 and QC 20 calibrators 059 045 TP 1 t...

Страница 148: ...ype of jack commonly used for stereo outputs in music systems Figure A 1 Pinout for the AC DC output jack Auxiliary connector The auxiliary connector in the base of the instrument can be used for input and output triggers See Triggers to receive GPS signals or for RS 232 serial communications Figure A 2 shows the pinout for the auxiliary connector Figure A 2 Auxiliary connector ...

Страница 149: ...Appendix A 136 Models SE and DL Block Diagram for SoundPro ...

Страница 150: ...evel The accumulated exposure to sound measured in a 24 hour sampling interval and artificially boosted during certain hours For CNEL samples taken between 7 p m and 10 p m are boosted by 5 dB samples taken between 10 p m and 7 a m are boosted by 10 dB The values reported by SoundPro SE DL ignore the threshold and use a 3 dB Exchange Rate regardless how those parameters are set Criterion Level Cri...

Страница 151: ...d is no longer explicitly needed A TWA of 90 dB is the equivalent of 100 dose The dose will double halve every time the TWA increases decreases by the Exchange Rate Example OSHA uses an Exchange Rate of 5 dB Suppose the TWA is 100 dB The dose would double for each 5 dB increase over the Criterion Level of 90 dB The resulting dose is therefore 400 If the TWA was instead equal to 80 dB then the dose...

Страница 152: ...erage the measured dose would double Some organizations such as OSHA in the U S have argued that the human ear self compensates for changing noise levels and they felt that the 3 dB Exchange Rate should be changed to more closely match the response of the human ear OSHA currently uses a 5 dB Exchange Rate which would mean that the reported dose would double with every 5 dB increase in the time wei...

Страница 153: ...rations of high levels can significantly contribute to the average level Example Assume the threshold is set to 80 dB and the Exchange Rate is 5 dB the settings of OSHA s Hearing Conservation Amendment Consider taking a one hour noise measurement in an office where the A weighted sound level was typically between 50 dB and 70 dB If the sound level never exceeded the 80 dB threshold during the one ...

Страница 154: ...t SPL measured over a time interval L_Mx Maximum SPL Highest SPL measured over a time interval Logging In sound studies the saving of measurements at fixed intervals during a study where each measurement is determined from data processed in the previous logging interval L_Pk Peak SPL This is the highest SPL value obtained during a study or a session A peak SPL measurement is affected by the freque...

Страница 155: ...octave bands in 8 octave bands ranging from 63 to 8000 Hz and is then plotted on the octave band spectrum using a set of curves NC curve evaluation uses a tangency method A tangency method is a process of comparing your measurements to a fixed curve The correct curve number is the lowest curve that meets or exceeds the measured octave values Typically this is used in HVAC applications Noise Rating...

Страница 156: ... 132 10 to 100 43 4 to 103 50 to 140 66 3 to 142 Preferred Noise Criterion PNC Curves The Preferred Noise Criterion Curves a type of tangency method was an update to Beranek s original NC curves that accounted for the lower frequency side of the criterion curves 1971 The PNC curves extended the range to 32 Hz instead of 63 Hz used in NC curves Projected time Prt A time interval used in some calcul...

Страница 157: ... impulse I time response relationships Time response can be described with a time constant The time constants for fast slow and impulse responses are 0 125 s 1 0 s and 35 ms respectively Impulse time response is 35ms rise with a constant decay of 2 9dB sec Figure B 2 Slow response to a tone burst Figure B 3 Fast response to a tone burst Burst duration t seconds Relative response dB Relative respon...

Страница 158: ...d that would deliver the same sound exposure as an accumulated exposure determined over a sampling interval RTime SEL is typically determined with a 3 dB Exchange Rate slow exponential time weighting and without regard to an Integrating Threshold SPL Sound pressure level A ratio of one sound pressure to a reference pressure See Reference Pressure on page 141 Because of the enormous dynamic range o...

Страница 159: ...ose upper band edge frequency is 1 26 times the lower band frequency Threshold An SPL value that defines a lower level of acceptable values Only SPL samples that exceed the threshold are used in some calculations TWA Time weighted average The constant SPL over an 8 hour interval that would produce the same exposure to sound as an exposure measured over a run time sampling interval Rtime Upper Limi...

Страница 160: ...es you can select F weighting flat which provides no weighting at all The four SoundPro SE DL weighting curves are plotted together in Figure B 5 where the F weighting curve has been shifted up by 5 dB for graphical clarity The tolerance limits for F frequency weighting are the same as A C and Z frequency weighting Figure B 5 All frequency weightings plotted together Windscreen A covering for a mi...

Страница 161: ...Appendix B 148 Models SE and DL This page left blank intentionally ...

Страница 162: ...4047 Office hours are 8 00 a m to 5 00 p m United States Central E mail 3Mdetectionmail mmm com Internet www 3M com detection International customers Contact your local factory authorized distributor from whom the product was purchased You can obtain the name and contact information of your local factory authorized distributor from 3M by using the e mail telephone or fax information given under Co...

Страница 163: ... obligations or liabilities For warranty outside the United States a minimum of one year warranty applies subject to the same limitation and exceptions as above with service provided or arranged through the authorized 3M distributor or our 3M European Service Laboratory Foreign purchasers should contact the local 3M authorized sales agent for detail THE IMPLIED WARRANTIES OF MERCHANTABILITY AND FI...

Страница 164: ...0 Installing 14 Power explained 15 C A Defined 137 C A measurement 30 Calibrate About 61 History cal screen 64 Post cal 61 Pre Cal 61 Steps 62 Calibrating 61 63 Captured curves Running 90 Captured curves Applications 87 Runing and viewing results 96 Setting up 88 Center frequency Defined 137 CNEL Defined 137 Communications View measurements remotley log to port 53 Contacting 3M 149 Criterion curve...

Страница 165: ... Overview 58 Range 60 Setting measurement type 26 Third octave band 3 Measurements Audiometric background curves 94 Bar chart 68 Changing what is displayed 66 Community noise 69 Criterion curves 91 Curves explained 87 Dosimetry screen 70 Filtered bar chart 68 Indicators descriptors 67 Navigational screens explained 65 Pause 75 Running 64 Setting captured curves 88 STI PA testing 98 Stop 75 Tabulat...

Страница 166: ...erb Time example chart 78 RT60 measurement mode 83 RT60 Test 82 Setup options 80 Setup screen 80 Review Indicator 20 Review mode 113 Room Criterion Curves RC Defined 145 Run Indicator 20 Lock 47 Run Mode security 46 Running Quick help list 58 Saving Setup 118 Screens general Diagram 18 Start 16 Screens setup Battery check 16 Comm Set 54 Screens time history back erase 72 Screens viewing Community ...

Страница 167: ... SPL Defined 145 STI PA Applying background noise capture curve overview 108 General setup guidelines 100 Modulation envelope screen 106 Modulation screen 105 Running a study 103 Setup 100 Steps applying captured curves 108 Viewing result screens 104 Stop 19 Indicator 20 Stop and pause Explained 75 Studies Explained 59 Study Scenario 59 Taktmx Defined 146 Third octave band Defined 146 Threshold De...

Страница 168: ...ality and select toxic combustible gases The 3M Detection brand of instrumentation is used by safety and industrial hygiene professionals to help comply with applicable occupational standards and regulations About 3M Personal Safety 3M offers a comprehensive diverse portfolio of Personal Safety solutions providing respiratory protection hearing protection fall protection reflective materials for h...

Отзывы: