


EcoWatch for Windows
Section 4
YSI Incorporated
Environmental Monitoring Systems Manual
4-33
MANUAL SCALE
Takes you to the
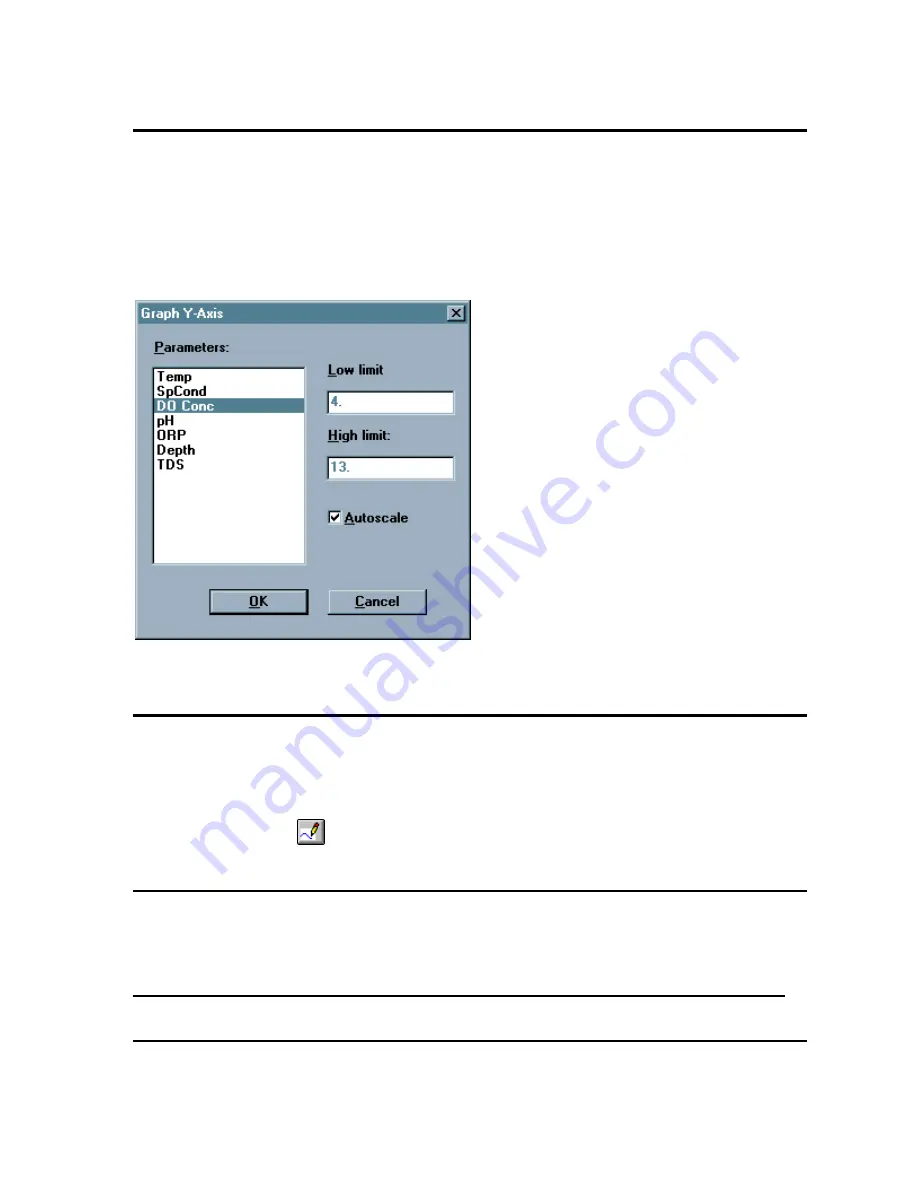
Graph Y-Axis
dialog box where you can set the scale for each parameter.
Graph Y-axis dialog box
To manually scale a graph, double click on its Y-axis labels. A dialog will come up
where you can set the scale. Note that you can manually set the scale for some
parameters and autoscale others. When the autoscale box is checked, the high and low
limits will be dimmed. See also the Autoscale command in the Graph menu.
.
REDRAW
If part of a graph is not displayed it could be because your window is sized too small to display it or
because you have just returned to EcoWatch from some other application. Maximizing the window and
choosing this command should display your graph correctly
Shortcuts
Toolbar:
CANCEL LIMITS
Choose this command to cancel the limits set by the
Limit Data Set
command.
4.3.7
SETUP
PARAMETER
Lets you select which parameters you want to analyze and how they will appear.
Summary of Contents for 6 series
Page 195: ...650 MDS Section 3 YSI Environmental Monitoring Systems Operations Manual 3 65 ...
Page 196: ...650 MDS Section 3 YSI Environmental Monitoring Systems Operations Manual 3 66 ...
Page 345: ...PAR Sensor Appendix K YSI Incorporated Environmental Monitoring Systems Operations Manual K 4 ...